What is Good Investing?

Here is a screenshot of my portfolio as of January 18th, 2019:

screen shot 2019-01-18 at 11.37.55 pm

I wish I could report that the notable change in my total portfolio holdings of about $4.2 thousand, or 31.6% from my previous update a few months ago was due to my superior stock-picking ability. The bulk of this gain came from portfolio infusions through winnings various competitions I participated in during my first year in college; optimistically, perhaps this can be viewed as a great return on my investment of time. Because of these infusions, it’s difficult to compare my portfolio to S&P returns but allow me to make it easy for you: I didn’t beat the market. In fact, I estimate that I slightly underperformed, in large part due to my concentrated investment in YY (approximately 32% of my total portfolio). The stock dropped approximately 40% from my original purchase price in large part due to trade war tensions between the United States and China (which don’t affect YY’s business, I should add). Nonetheless, I was able to average down my position dramatically.

I don’t say this shamefully; in fact, the probability of underperforming the market in a given year even if you are endowed superior stock-picking ability is fairly high. Warren Buffett underperformed the market about 35% of the time while he ran the Buffet Partnerships in 1960-1970. Allow me to reproduce a sentence I wrote in a previous post:

“This short-term gain (over the course of 2 months) does not excite me in the slightest. Tomorrow I may be drowning in red ink; the vacillations of the broader market (and consequently my stocks) do not interest me nor do I attempt to forecast my gain over any time period… The only claim I make with these businesses is that they will outperform the broader market over a period of many years.”

I’ve kept my promise so far, so it seems. What I do regret, however, is my portfolio turnover, that is, how much time I spent buying and selling different stocks. In my last portfolio update, my portfolio consisted of 7 stocks, only three of which you see here today. To be fair, three of the seven you don’t see here today were classified by me as short-term investments in which there was extreme mispricing; nonetheless, to reiterate Buffett’s forth law of motion:

“For investors as a whole, returns decrease as motion increases.”

Reflecting on this, I’ve created a sizable cash position (over 30% of my portfolio) that will be utilized only in the best of opportunities as they present themselves. Too many investors cannot stand the fact that “cash in the bank isn’t earning anything.” This thinking leads to imprudent and hasty decision-making in hopes of having a high invested position, and many investors fail to recognize that earning 0% is better than losing your money in a foolish investment. True opportunities are extremely rare, and if one is finding a “great” investment every other day, their standards are too low. I’m happy to keep this cash position for many years, and I’m in good company: the best companies in the world often have high cash positions to take advantage of opportune times (examples include Berkshire Hathaway, Baupost Group and Apple).

Picking Good Companies and Making Good Investments

The titans of finance may disagree with me, but I firmly believe that a 10-year old with a basic arithmetic background can choose five great companies as well as a finance graduate. In fact, the 10-year old may be a better company-picker because he/she won’t be distracted by all the noise the finance major learned in college. In fact, after taking my first finance class, I had a disturbing revelation: in the whole semester, we calculated measures of risk and expected return on different stocks/portfolios yet not once did we talk about the fundamentals of the company in question. In fact, risk and expected return is exclusively a function of its past stock price movements.

One may also logically argue that a publicly traded company is not fundamentally different than a private company; the only real difference is that the private company does not offer daily quotes of what the investing aggregate believes is its value. Therefore, shouldn’t calculations of risk and expected return of private and public companies be similar? Well, it turns out that traditional finance theory has not concocted a way to quantify risk of a private company (yet a year after it IPO’s, suddenly the risk is straightforward).

But I digress. Anyone can find great companies and determine with reasonable accuracy whether their current price is appropriate in light of its business prospects (the latter might require some specialized knowledge that a 10-year old doesn’t have, but it’s not unbearably complicated). If that is the case, why do so many smart Ivy league graduates fail to generate decent returns? The reason is that finding good companies and making good investments are two different things: finding good companies is straightforward, almost a science, while making a good investment has a behavioral component that dumbfounds even the smartest money managers. The interesting and profitable conclusion from this information, however, is that in their education, most investors focus on the easy part (finding good companies) and fail to develop the emotional vitality required for good investing. An interesting observation: there are classes in The Wharton School dedicated to both finding good companies (FNCE 207, corporate valuation) and making good investments (FNCE 239, behavioral finance). All of the sections of Corporate Valuation are filled to the brim, and there is a long waitlist to get into the class. Behavioral Finance, on the other hand, is half-empty. More interestingly, Corporate Valuation is rated as the more difficult class, even though the greatest investor in the world, Warren Buffett, says otherwise:

“Investment problems, they’re easy. It’s the human problems that are the tough ones.”

Because of the insistence of academics, students and practitioners of finance, I have decided there is an oversupply of individual company analyses; for this reason, you have not been seeing much of them on this blog. I prefer to focus on the more difficult portfolio management aspect of finance; nonetheless, I’ll provide a quick description of my many investments and my abridged rationale. You can find my TSCO analysis here, YY here and NVR here.

Enovo International is a subprime lender, that is, they provide loans to those who typically get denied credit at traditional financial institutions. In one sentence, it’s a bank that services those with bad credit. At first look, this seems like a terrible business; however, these loans are priced such that Enovo still makes a profit on defaulted loans. Its two big competitors are CURO and Elevate Credit, but Enovo is the largest. The name of the game here is the interest rate spread between the liabilities of these companies and the earnings power of their assets (i.e. loans). For example, if Enovo gives me a $100 loan at a 90% APR, it must fund this loan through its own loan; say it borrows $100 at 15%. Assuming I pay the loan in full, Enovo receives the 75% spread annualized (less any operating expenses for servicing this loan). Thus, the APR a company is able to provide is entirely dependent on its cost of financing; companies with a low cost of capital will be able to lower the APR of their loans or earn a higher spread on their existing loans. Enovo’s cost of capital is about 9-10% today, which is fairly lower than its competitors (Elevate, for example, has a cost of capital above 10%). The idea is that as Enovo continues to grow, there are a few value-adding factors at play: (1) operating expenses will decrease as a % of revenue through economies of scale (there are little incremental expenses of servicing a new loan), (2) cost of capital will decrease and certain loans can be funded with equity and (3) more competitive pricing can help gain market share. Finally, there are some macro factors that can facilitate this process. Traditional brick-and-mortar payday lenders are going out of business because of regulatory upheaval, leaving a lot of white space for fin-tech like companies such as Enovo which have lower operating expenses. Moreover, recent regulations favor those lenders who can lower their APR the most, and Enovo is one of the frontrunners on this front.

Triple S-Management (GTS) is primarily a property and casualty insurance company in Puerto Rico that traded at above $40; after the hurricanes hit, the stock fell to ~$15. The question we should ask ourselves is: can GTS stay solvent and achieve profitability after paying for these new liabilities? This is a very difficult question to answer, especially considering that there are dramatic regulatory changes in the region as well. However, some things to consider is that in the life insurance segment, GTS has the exclusive right to use the Blue Cross Blue Shield name in the country and controlled over 40% market share. Moreover, while the company is reporting earnings of about $50m, certain adjustments indicate that its true earnings (equity-method investments) are closer to $70m, relative to a market capitalization of ~$400m when I purchased it.

Graham vs. Buffett

Most adherents of value investing will distinguish themselves in two camps, the Graham followers and the Buffett followers. The Graham followers will buy any company as long as it meets one criterion: absolute cheapness with the ability to at least double from its current market price. According to them, a well-diversified portfolio of such cheap companies should outperform the market. Buffett followers, on the other hand, place emphasis on the quality of the company, and only buy great companies and good prices. Some go insofar as saying one can buy a great company at its fair, or intrinsic, value. Personally, I do not try to place myself in any of the two camps. As Charlie Munger says:

“All good investing is value investing.”

In fact, in his early days, Buffett bought extremely cheap companies regardless of the underlying business; his most well-known purchase, Berkshire Hathaway, in 1962 was such an investment (back then Berkshire Hathaway was a textile manufacturer). And it wasn’t until only a few years ago where he advocated buying great companies at fair prices.

It’s dangerous to constrict your opportunities because you steadfastly adhere to a very specific philosophy. Facebook may be a great investment at $60, or 10 times earnings, but according to Graham followers one should only buy companies trading for less than book value. Moreover, a company trading for $5 with $8 net cash per share about to undergo a quick liquidation may be a great short-term investment, but the Buffett followers would never touch it because it doesn’t have a “durable competitive advantage”. As Seth Klarman advocates, it’s important to have a flexible mandate, that is, be open to investing in many types of situations as long as you’re buying something for less than it’s worth. There are too little opportunities for great investments and a great many people looking for them; one should not squander these opportunities just because they only look at small cap stocks, or tech stocks, or distressed debt, etc. To give an illustrative example, after the tech bubble in 2000, what might you guess were the best performing assets in the subsequent two years? The answer is commodities. Those who weren’t looking were never be able to profit off these developments. Those who did didn’t have sexy investments to talk about during cocktail parties, but at least they made millions.

A Short Word on Housing

A few months ago, I purchased shares of NVR Homes (NYSE: NVR) and the company current makes up 15% of my portfolio. At my time of purchase, the NVR had a pre-tax earnings yield of ~10% ($3,000 vs. ~$300/share pre-tax). Notably, homebuilders have been going through a rough trough in terms of price action with stocks like NVR, D.R Horton and Lennar all falling over 30% over the past six months. Specifically, NVR is down almost 40% from its high and about 25% since my purchase.

When I am looking for opportunities to deploy capital, I do not care one bit about subsequent or previous price action. Moreover, large vacillations in my portfolio do not excite or depress me at all. What makes my mouth water, rather, is a company that can consistently profitably grow its BVPS. For these reasons, I tend to take large positions, usually because of doubling down my initial purchases after subsequent declines in stock price. In fact, my largest two positions make up approximately 40% of my portfolio.

I recognize that although NVR is my second largest position, I did not thoroughly explain my investment rationale. Instead of risking my readers to dismiss such a large purchase as silly and imprudent, and because many people are looking for a justification for the price action that we’ve seen over the past few months (although in my opinion, these justifications are often superfluous; every price decline/appreciation mustn’t necessitate explanation), I find it incumbent that I provide my extended rationale for why NVR is a wonderful company. Given capital, I would happily continue buying shares at these levels.

Housing Downturn Overdue?

A quick Google search should reveal fears of a housing downturn over the next few years. Over the past few months, housing starts have been soft and increasing in home sales pricing seem to have slowed down. In fact, in quarter two, while beating EPS, NVR missed revenue estimates, sending its stock down 6% the next day. Clearly, the market is fearful of an oversupply of houses and a potential price decline. Is this warranted? Here is the graph most analysts refer to of housing starts going back to 1959.

Housing Starts

1.5 million houses seem to be the sweet spot. Typically, when we go above that mark, there is an ensuing decline, often drastic. We can also clearly see the excesses of the bubble leading to the 2008 housing debacle. The rhetoric typically goes like such:

1. We are approaching the 70-year average in terms of housing starts; therefore, the growth that we’ve seen in the past within these homebuilders is likely to slow down as the supply of houses increases.

2. In every historical housing boom, we have not been able to sustain housing starts above the average line for longer than a few years (2008 being the exception).

3. Each downturn is characterized by substantial and instant declines in the supply of housing.

4. Therefore, the profits we’ve seen in these homebuilders like NVR are artificially high, riding the tailwind of the housing boom.

I see some merit in this argument, except for the fact that we were producing houses above the average from 1997 to 2008, a period of 11-years. Nonetheless, based on this data, it does seem to indicate that future large returns on homebuilder stocks are evanescent. We are already verging on passing the average line (if you adjust for the extreme values, we have already passed the line). However, I would like to present my interpretation of these same data. Firstly, in 1959, the U.S. population was less than 150 million compared to over 320 million today. Today, we have a much larger middle class (i.e. the people who buy homes) than any-time in history. The question I would pose is don’t more people need more houses?

U.S. population since 1959:
US Population
I’m not an expert on the real estate industry, but my intuition tells me that today we need about double the houses we needed in 1959. If that is the case, why the insistence on housing starts not adjusted for population? People love to focus on historical cycles and extrapolate those cycles into the future. While it is true that cycles repeat themselves and borrow elements of the past, they never are the past. Mark Twain is rumored to have said, “history doesn’t repeat itself, but it does rhyme.” The logic thrown around in investment circles goes like this: “This is the longest boom in history. We are long overdue for a downturn.” It is difficult for me to find a morsel of merit in this statement. Howard Marks himself said when he came to my university to give a talk, “We are in the eighth inning of the economic cycle, but we don’t know how many innings the game will last.”

Compared to the past, this recovery in housing has been the slowest (slope of the Housing Starts graph), thus mitigating the possibility of an oversupply to an extent. Nevertheless, because the utility of a housing starts graph without adjusting for population is limited, allow me to present a version that is more consistent with what drives demand for housing: population growth.
Housing Starts Per Thousand People

Suddenly we aren’t so close to the average line. In fact, current housing starts per capita are at a historical low. This just goes to show the severity of the 2008 crash. With this visual, it is much easier to make the case for significant gains in the housing market over the next decade: we are currently producing a little under 4 houses per thousand people vs. the 70-year average of about 6. As it has been since the financial crisis, NVR Homes will take a disproportionate share of this gain going forward due to its scalable and low capex model. With no debt on its balance sheet and prudent capital allocation policies, I can easily NVR continue to make strides in this market along with D. R. Horton and Lennar, among others.

Is Housing Expensive?

Home prices have been increasing dramatically over the past few years; in fact, much of NVR’s growth is due to increases in the average selling price of its homes, which currently stands at about $325,000. Thus, the bears’ argument is magnified by the following: in addition to production declines, average selling price declines will continue to cause homebuilders to lag the general market. The following is the most commonly cited data for home prices: The S&P Case/Shiller U.S. Home Price Index.

Cash-Shiller U.S. National Home Price Index

We’ve already peaked the high of prices before the financial crash with no sign of slowing down. Surely, we are overdue for a substantial decline in home prices soon… Not exactly. Again, we must put these figures in context, something the investing community is seemingly not doing. Have home prices become more expensive relative to our buying power? Not at all.

Real Home Prices vs. GDP per Capita

In interpreting this graph, we must pay attention to the slope. When home prices rise faster than income, we should be wary (as was the case in the years leading up to the 2008 crash). However, when home prices rise in tandem with income (as was the case in the 1990’s), things are stable, and declines are minor. This insight is intuitive; however, many people in the investing community don’t seem to have this intuition when simply quoting price increases. Obviously, prices increased dramatically from the largest cyclical downturn in history from 2008 to 2013, but this is expected; as the graph shows, growth in house prices has stabilized since 2014.

But what about mortgages? The Fed has hiked rates three times in the past year and has indicated that it plans to continue doing so soon. With every hike, homebuilder stocks trade lower and lower. Here is the rationale:

1. Mortgage rates will increase in tandem with interest rate hikes

2. Because we expect inflation to be 2% over the long run, mortgages will become more expensive in real terms.

3. Because they are more expensive, less people will be willing to take on a mortgage to buy a home, thus lowering demand for new homes, hurting homebuilders.

I do not agree. While theoretically rising real mortgage rates should decrease demand for mortgages, we do not see this in the real world. Why? Homebuying is influenced by a myriad of factors, and mortgage rates empirically rank low on that list. While interest rate hikes may influence short-term demand for housing for psychological reasons, it is unlikely to have much bearing on long-term demand for housing. Long term demand is determined primarily by (1) population growth, (2) number of families being created and (3) Income or GDP per capita. To illustrate this point, here is perhaps the most unintuitive graph of this whole write-up:
Real Mortgage Rates vs. Housing Starts

If higher real mortgage rates lowered the demand for housing in the long run, we should observe a negative correlation between these two series (i.e. higher rates correspond to lower starts and vice versa). If we divide this graph into two periods- 1971-1995 and 1996-2017- we see something very interesting. In the first period, there is a positive correlation between real mortgage rates and housing starts (i.e. more houses were built when mortgages were expensive. Does that make sense?) In the second period there is no correlation between real mortgage rates and housing starts. There is no reason for any of this: rather, over the long run, mortgage rates do not affect demand for housing (I encourage you to plot housing starts vs. the three demand drivers I mentioned; I’m sure you’ll find a positive correlation).

For those who still aren’t convinced (it is an unintuitive result; even I was surprised), perhaps take solace in this following:
30-Year Real Fixed Mortgage Rate

Real mortgage rates now are still well below what they used to be. In fact, we are a full 200 basis points lower than the 70-year average. It’s important to take these interest rate hikes in perspective: The Fed is simply trying to revert the economy back to pre-crisis levels. Because rates have been at crisis-level lows for over a decade (in his A Short History of Financial Euphoria, Galbraith talks about the magic of a decade on our psychology), people have begun to take them as the norm when we are in fact paying less for mortgages that we ever have in history.

To conclude, housing isn’t in oversupply; you just aren’t looking at the right numbers. Housing isn’t expensive; you just don’t have a long enough horizon.

The Yardstick of Success

How do we measure success, that is, investment success? The conventional method is to measure the value of a portfolio at the beginning and end of a given period and calculate its compounded annual growth rate (CAGR). If this is greater than the CAGR of a given market index (i.e. the Dow or S&P 500), then the investment manager is considered to possess superior stock-picking ability. If the portfolio CAGR lags that of the S&P, the investment manager is a lemon and has no business picking stocks.

Randomness

As with many principles of investing, this method is theoretically sound but impractical in practice; the reason being it makes no distinction between the flukes from real talent in a world where flukes greatly outnumber real talent. Buffet outlined this nicely in his essay, The Super Investors of Graham and Doddsville.

Before we begin this examination, I would like you to imagine a national coin-flipping contest. Let’s assume we get 225 million Americans up tomorrow morning and we ask them all to wager a dollar. They go out in the morning at sunrise, and they all call the flip of a coin. If they call correctly, they win a dollar from those who called wrong. Each day the losers drop out, and on the subsequent day the stakes build as all previous winnings are put on the line. After ten flips on ten mornings, there will be approximately 220,000 people in the United States who have correctly called ten flips in a row. They each will have won a little over $1,000.

Now this group will probably start getting a little puffed up about this, human nature being what it is. They may try to be modest, but at cocktail parties they will occasionally admit to attractive members of the opposite sex what their technique is, and what marvelous insights they bring to the field of flipping.

Assuming that the winners are getting the appropriate rewards from the losers, in another ten days we will have 215 people who have successfully called their coin flips 20 times in a row and who, by this exercise, each have turned one dollar into a little over $1 million. $225 million would have been lost, $225 million would have been won.

By then, this group will really lose their heads. They will probably write books on “How I turned a Dollar into a Million in Twenty Days Working Thirty Seconds a Morning.” Worse yet, they’ll probably start jetting around the country attending seminars on efficient coin-flipping and tackling skeptical professors with, “If it can’t be done, why are there 215 of us?”

As another example, imagine having millions of monkeys on typewriters squabbling rubbish. Well, there are only so many combinations of the English language and eventually one monkey will reproduce, word for word, Homer’s Iliad. Without examining the sample size of monkey’s, one may mistakenly be led to the conclusion that this particular monkey was endowed with superior intellect when in reality the result was simply a lesson in combinatorics. In fact, with enough monkey’s (i.e. a large enough sample size), we should be surprised if no monkey did reproduce the Iliad. The book Fooled by Randomness discusses this issue at length, called survivorship bias.

Many of us do not ponder the size of the global financial industry, and its subset, the investment management industry. The focus on averages: how everyone performs relative to the S&P 500, or the composite average of the market. Statistically speaking, however, there will be outliers who outperform the market for many years even if every investment profession is just that- average- because of statistical variance. Speaking of statistics, the majority of stock market movements consist of “noise” as labeled by statisticians: movements with no underlying cause or meaning. In other words, if we were to generate random points to forecast the next week’s movements of the S&P index, we would be fairly close to modeling the actual S&P movement because the majority of it is random. This makes statistical inference very difficult, as it needs to separate the noise (or the monkey’s) from actual outperformance (or above-average ability). Turns out, it takes about 65 years of market outperformance to determine to a statistically significant degree superior stock-picking ability because of the prevalence of noise. How many investment funds created in 1953 still exist today?

Because of the randomness of macroeconomic events, fund performance and risky behavior, it becomes impossible to identify a suitable time period in which to measure fund performance. Statisticians threw out the number 65 years but seeing as it approaches the average human’s life expectancy, this is impractical for obvious reasons. Take the fund manager who started a tech-based hedge fund in 1990. Many people will accept 10 years as a more-than-suitable period to measure superior stock picking ability. By 2000, this lucrative money manager will have almost certainly beaten every market index simply be investing in the technology darlings of the time: AOL, IBM, Cisco, etc. He will have offered his expert opinions on CNBC and justified his investments at sky-high prices on the basis of future growth in his investor letters. Amid thousands of clients seeking to get rich quick, he would have a few skeptics, who would simply be waved off as jealous onlookers unable to replicate the performance of this “legendary” investor. Just two or three years later, anyone looking back on his performance over the decade (that is, 1992-2002) would be unimpressed and dismiss him as a speculator who rode the wave of the tech bubble. Fast forward to present day, seeing how many of those tech darlings have risen to their previous rigor, he may have slightly above average returns, and evaluators would say he is “alright” at picking stocks. Which view is correct?

Risk

The second issue with conventional performance measures is risk. Absolute return does not take into account the risk one undertook to achieve said returns; however, one who can achieve 20% annual returns without risk is far better than one who achieves the same return only by taking on large amounts of risk. However, here we face a double-edged sword: if a risk materializes, one may lose all of his/her gains in addition to the principal, but if a risk doesn’t materialize, one may never know it existed in the first place. Consider the housing crisis of 2008. If you attempted to measure fund performance in 2006-2007, you may have come to the conclusion that many managers making heavy bets on derivative securities secured by mortgages were, in fact, very successful. In addition, banks, faced with loose lending standards and a liquid economy, were happy to grow their asset base to astronomical heights- these banks looked very successful on paper. Fast forward two years and those same fund managers were crushed by their own leverage, and banks witnessed a record amount of defaults. The risk materialized and those swimming naked were revealed. But now consider the alternate reality in which there never was any housing crash: the fund managers would continue to enjoy the mirage of success without understanding the underlying risk of their investments. Fast forward to today, and there are perhaps many ‘above-average’ capital allocators making risky bets; these risks may or may not ever materialize and their success rests upon a stroke of luck or misfortune.

The ideal measure of investment success would be a “risk-adjusted return”; alas, it is impossible to quantify risk. Finance textbooks quantify it as beta, or volatility: however much a said stock moves relative to an index is dubbed as the riskiness of an investment. A stock that has exhibited large swings in value is considered risky while a steadily moving stock is less risky. I cannot even begin to expound on the reasons why I disagree with this definition, but suffice to say, risk does not lie in stock movements. Rather, risk is found in business developments; for example, risk that a company is going bankrupt or a risk that a new production method will be insufficient to meet demand. In other words, a stock that exhibits low volatility, but is steadily trending to $0 is definitely riskier than a highly volatile stock of a company with no debt, trading at ½ net asset value (NAV). Perhaps volatility was chosen because it is easily measurable, as business risk cannot be measured even after the fact. How can we quantify the risk fund managers took in dabbling in the lower tranches of mortgage-backed securities? I admit I cannot think of any way. 

The Yardstick of Investment Success

It is easy to criticize the status quo but difficult to propose a better system. After all, considering the elusiveness of risk, it is near impossible to come up with an accurate measure of risk-adjusted returns. The question remains: how should we evaluate a fund manager without using absolute returns? I propose we let go altogether of returns in a given time period unless we have a record spanning many decades (time may prove that even that isn’t enough). We can supplant returns with philosophy. How does this manager pick his stocks? Does he employ leverage when making investments? Does the math work out? How many lavish assumptions does he employ in his analysis? When we can agree that a fund manager’s strategy for picking stocks is logically sound while being agnostic to historical returns, we will be leagues closer to picking the future winners and separating the monkey from Homer.

The much more difficult solution lies in portfolio management. No one is immune to the psychological ravages of investing; thus, it becomes paramount to separate performance from noise. After all, underperformance that’s simply stock market noise will bring unneeded despair to the investor, and (more dangerously) outperformance that’s simply noise will being unwarranted egotism into the mind of the investor. Nonetheless, in spite of the many of the vacillations of my portfolio, I have an internal system that keeps me sane. It involves removing the focus away from absolute returns and mentally practicing the most important quote by Benjamin Graham:

“Investing is most intelligent when it is most business-like”

Everyone knows this quote, few practice it when buying businesses and almost no one uses it to guide their mental framework. I blame this on the fact that the majority of literature regarding value investing is focused on individual stock-picking rather than portfolio management. When buying a stock, one should view it as buying a piece of a business; when this framework is employed, you will say no to almost every single idea and only invest in your highest conviction ideas. But how should one view his collection of pieces of businesses? Let us think of this issue in the following way:

Say you purchased a company that produces chairs for $100 million. Every year, the company produces for you $10 million worth of chairs that cost $5 million to produce. After subtracting expenses, you’re left with $5 million to put into your pocket every year. Two years down the road, how do you measure the successfulness of your investment? Do you cold-call private equity firms to get a quote for your business? Do you take your articles of incorporation and tour the country interviewing potential buyers of your company? Or do you simply think, “I paid $100 million and this business is giving me $5 million every year, or 5% of my investment.” Most real business-owners would use the latter method to measure their performance.

If that is the case, why do investors measure their performance by what their business is fetching in the market (i.e. the stock price). This is akin to businessmen valuing what their business produces for themselves by finding an outside buyer. It simply goes against common sense. An interesting issue to ponder about is why self-proclaimed value investors do not realize this concept, even though they see themselves as “buying stakes in businesses, not stocks.” If investing is to be business-like, measuring performance ought also to be business-like, or in terms of earnings yield (and potential earnings yield) rather than stock price. Earnings yield does not vacillate as much as stock prices, and changes if the earnings power of a business increases, or if you can buy the business at a cheaper price, and value investors look for just that.

As an example of this method in practice, consider a five-stock portfolio with a weighted average earnings yield of 10%. That is, if the cost of the portfolio is $100, the investor would be entitled to $10 of earnings in aggregate from all his positions. Five years from now, the earnings yield is 20% (increased by 2% every year). This hypothetical portfolio may move like this:

Screen Shot 2018-08-20 at 12.17.50 PM

We do not know whether the appreciation from $100 to $165 is short-lived or permanent, whether it’s simply noise in the market or an adjustment to fair value. However, we do know that if we owned stakes in these businesses, we will have been entitled to $117 over the course of these five years. To calculate our investment success, we may add the $117 to $165, resulting in a total “value” of $282, or a 182% return over the course of 5 years, or about a 23% CAGR. Of course, this is not actually the return achieved by the portfolio; however, it does share the spotlight of capital appreciation to the earnings power of the underlying business in terms of measuring investment performance. It is by no means a perfect method but will allow investors to make more intelligent and businesslike decisions.

My Portfolio  

I hope I’ve dispelled any faith you had regarding conventional performance measures because my portfolio is performing poorly based on those measures (you were rightly skeptical as to why I chose now to present this dissertation on the fallibility of traditional measures).

Screen Shot 2018-08-20 at 12.26.11 PM

NOTE: I’ve changed the format of presenting my portfolio to make it easier to interpret. I’m happy to supply actual screenshots of my portfolio upon request.

The Case Against Amazon


Amazon logoAmazon is heralded as the darling of our generation, so much so that analysts galore are singing choruses we haven’t heard since the 90’s. Here are some of the stars:

Amazon is different from other technology firms” 

Traditional financial metrics do not capture Amazon’s moat”

“Of course, the numbers don’t make sense! Amazon is a bet on the future

History has shown us that when valuations outstrip business performance, trouble usually ensues. In the late 1990’s, valuations existed that would make Ben Graham, the father of value investing, turn in his grave. AOL at one point traded for a spectacular 186 times earnings; the darlings of the time- Microsoft, IBM, Enron, WorldCom, etc. all fell victim to the ravages of the time. Surely the investment community believed that the valuations of these internet superstars were justified on the basis of future prospects. What a future that was… an equity investor would have earned a fat 0% on his investment in the S&P during the period 1997-2003. In real terms, he would have lost a substantial amount of his principal.

The Value of a Business

One must not, however, immediately shun high valuations without further analysis. For example, an investor who disregarded Adobe five years ago for its seemingly high valuation will have missed its transformation into a wonderful service-oriented firm. Nonetheless, the notion that an investment in Amazon is a “bet on the future” because “the numbers don’t make sense” is an equally flawed judgement. The value of a business is, by definition, grounded in reality. If we expect substantial growth in emerging industries over the next decade, these assumptions ought to be incorporated in cash flow projections.

Therefore, I’d like to start by defining the value of a business since it seems like this definition is often lost the moment Amazon becomes a target of discussion. According to academic theorists and sensible people, the value of a business is the present value of current and future cash flows discounted at the appropriate discount rate.  

To motivate the discussion on discounting, here is an excerpt from “The Cost of Debt and Equity Funds” by David Durand:

“Suppose, for example, that a businessman has two possible ways to operate his business. Operation A promises him an annual return of $6,500 in perpetuity, and Operation B promises him $10,000 in perpetuity… The businessman will certainly choose Operation B with its higher income… But suppose this businessman has another alternative- Operation C- which gets under way slowly and thus promises him $7,000 the first year, $9,000 the second year and $10,500 thereafter… Is the combination of $7,000, $9,000 and $10,500 thereafter greater or less than $10,000 in perpetuity?”

That is, the present value of a future stream of cash flow can be impacted by a variety of factors (i.e. inflation, risk and volatility). In non-finance terms, “a bird in the hand is worth two in the bush.” With this in mind, the value of any company is determined exclusively by two factors: (1) cash flows for every year and (2) the rate at which we “discount” future cash flows to present value.

I find it ludicrous to value companies on the basis of “comparables” or using historical valuations. Financial metrics like “price/earnings” and “EV/EBITDA” and discounted cash flow analysis are cut from the same cloth. In fact, the P/E ratio is simply the inverse of the discount rate minus the expected growth rate of future earnings. This is the reason using comparable peers is so logically incorrect. Why should two companies with different capital structures and expectations of future profits trade at similar multiples simply because they are in the same industry? Yet this is precisely how many analysts value Amazon. Sure, if you want to deduce what a stock may trade at in a future period, this analysis may suffice, but it has no place in valuing a business. To debunk using historical valuations, in the period 1900-1920, the average P/E ratio of the S&P was 12.4. For the last decade, it has been ~20. Are we to say that the S&P is “overvalued” on this basis? The United States economy has changed in the last century and so have expectations of future corporate profits.

Free Cash Flow: The Holy Grail

Amazon the company seems to understand this. According to its CEO (and, not coincidentally, the richest man in the world) Jeff Bezos, “When forced to choose between optimizing the appearance of GAAP (Generally Accepted Accounting Principles) earnings and maximizing the present value of future cash flows, we’ll take the cash flows.” (1997 Letter to Shareholders). According to the company’s most recent 10-K:

Our financial focus is on long-term, sustainable growth in free cash flows

In fact, Amazon has conveniently provided three separate measures of free cash flow on its annual report. Moreover, the company’s consolidated financials begin with the cash flow statement. The problem with this statement is that the term “free cash flow” is very elusive; since GAAP has not outlined a specific way to calculate FCF, companies are literally free to choose how the metric gets calculated. Generally, however, the investment community accepts the definition of FCF to be operating cash flows less capital expenditures. Using this definition, we see that there is a wide divergence between FCF and Amazon’s reported earnings: cumulatively, for the past 10 years, reported earnings were about $9.6 billion compared to FCF of $36.8 billion. Moreover, when using earnings to calculate return on equity, Amazon’s ROE comes out to about 10%, or average. When using the 2017 FCF figure, ROE was greater than 20%. Obviously, management wants us to focus on the latter figure; however, even this figure is too low to justify Amazon’s current valuation. Let’s run through some numbers.

Amazon is trading at ~$1,800. FCF per share comes out to $13, implying an initial yield of 0.7% on our investment. Average FCF for 2008-2010 was $2.3 billion and $7.8 billion for 2015-2017; in other words, FCF increased by a factor of three over the course of seven years. Let’s assume Amazon can triple its current FCF in the next five years to $24 billion. Assuming no dilution of shares (which, as I’ll explain later, is a lavish assumption), FCF per share comes out to $48, implying a yield of 2.6% on your initial investment. In fact, if we were to assume this same growth rate going forward (about a 25% CAGR), it would take 16 years simply to recoup your initial investment on a FCF basis, or a return of ~6.25% per annum. This simple calculation makes it difficult to understand the argument that an investment in Amazon is an investment on future growth. Here we used extremely generous growth assumptions (for reference, less than 10 companies from the inception of the U.S. stock market have consistently achieved 20% or greater compounded earnings growth for more than 15 years), and yet we hardly achieved a good return on our investment. What this calculation does show is that the market expects, based on its current valuation, Amazon to increase its FCF per share in excess of 30% for the foreseeable future.

Which is entirely possible… after all, Amazon.com is a one-of-a-kind. Nevertheless, there is reason to believe that FCF that we calculated, and the measure than Amazon itself likes to tout, it nowhere near the true cash-generating power of Amazon the business. A high-flying stock can benefit a business in the short-run in terms of earnings, but all good things come to an end, and only true business earnings power creates value. There are a number of factors and corresponding accounting shenanigans that have benefited Amazon the stock but have no bearing on Amazon the business. I will go through each of these, and then come up with my own definition of Amazon’s FCF potential in the future. Only then will we see that increasing “on paper” FCF by 30% a year will not be enough to give investors a good return on investment.

AMZN- The New Currency

If I owned a business with a net worth of $50 million and the market temporarily valued it at $100 million, and I wanted to buy another company for $20 million, I could do two things. One, I can pay $20 million in cash and two, I can pay for the business in stock. See, the market is valuing every $1 of my tangible net worth as $2 ($100 million/$50 million). Therefore, instead of paying out $20 million in cash out of my retained earnings, I “pay” $20 million in my stock. In essence, I’m only giving away $10 million of my net worth as opposed to $20 million if I pay in cash ($20 million/$100 million times $50 million).

When the market affords a high valuation on a company’s stock, it essentially becomes an overvalued currency- the idea is that if I pay using the overvalued currency, I save more money. If the market values your stock higher than your net worth, it pays to pay in stock and vice versa. For Amazon, its high-flying stock has reaped rewards in the form of stock-based compensation (SBC). Instead of paying employees in cash, the company takes a portion of the salary and pays it in stock (hence the name). Amazon has clearly taken advantage of its high valuation, with stock compensation expense increasing from $1.1 billion in 2013 to $4.2 billion in 2017.

At first look, SBC seems great- there is no cash outflow and employees get paid. However, the problem emerges when you consider the dilutive effect of issuing more shares. Even if cash flows increase, if share count also increases, the net effect on FCF per share declines. Since 2008, Amazon’s share count has increased from 432 million to 493 million, with the majority of the increase occurring in the previous five years. As long as Amazon’s stock continues to rise, SBC compensation should increase. And why shouldn’t it? There is nothing wrong with a company using SBC instead of cash to pay its employees. The problem arises when the company touts its measure of FCF as being the holy grail when it adds back SBC expense. Yes, it is not a cash outflow, but it still dilutes existing shareholders. More importantly, if and when a company’s stock stops sensationalizing, it won’t be able to afford current levels of SBC expense. How will the company fill this shortfall? You guessed it- cash from operations. In fact, for many years, Amazon had this disclosure in its calculation of FCF:

“Operating expenses without stock-based compensation has limitations since it does not include all expenses primarily related to our workforce. More specifically, if we did not pay out a portion of our compensation in the form of stock-based compensation, our cash salary expense included in the ‘Fulfillment,’ ‘Marketing,’ ‘Technology and content,’ and ‘General and administrative’ line items would be higher.”– AMZN 2014 Annual Report

In other words, if our stock stops being so attractive, get ready for higher operating expenses as we actually use cash to pay our employees. Surprisingly, this disclosure is non-existent in Amazon’s most recent annual report- something to ponder about. SBC is an expense that should be included in our calculations of earnings, and not simply ignored because its “non-cash” in nature. If we didn’t have it, it would be replaced with cash.

To make matters worse, SBC is a double-edged sword. To offset the negative dilutive effects of issuing more shares, Amazon must engage in proportional share buybacks. However, similar to how issuing shares is accretive to value only when the issue price is greater than the value of the business, repurchasing stock is only accretive to value when it is done under fair value. Management seems to understand this: Amazon had not repurchased its shares since 2012. This system of issuing stock with no corresponding buyback works perfectly when the market is bullish, resulting in higher FCF and cash available for more productive investments; but this system will easily backfire if future stock performance does not mirror what we’ve seen in the past five years.

The Accounting of Leases

 Leases are fairly straightforward in the traditional sense, but the accounting can get messy at times. Essentially, according to accounting rules there are two types of leases: operating leases and capital leases. The nuances between the two are a topic of another discussion, but in general capital leases are recorded on the balance sheet as a liability (like a loan) while an operating lease assumes no “ownership” of the property (an “off balance sheet” arrangement). In practical terms, the two have essentially the same implications in the real world, and in calculating real free cash flow, we focus on the real world, not the accounting world.

Operating leases are recorded as operating expenses in the income statement (like advertising); capital leases, however, are recorded on the balance sheet and at the end of the lease term, the asset is transferred to the lessee. For example, I want to buy an office, so I lease it for 5 years, paying monthly payments; at the end of the lease term, I can purchase the office for its residual value (similar to a loan, the monthly payments are “interest” and the final purchase is the “principal” payment). Because capital leases are treated at loans, they are recorded under “cash used in financing activities” instead of capital expenditures. In reality, the end product of capital leases and capital expenditures are the same: ownership of PPE. Therefore, in a real sense, the cash flow item “repayments on finance lease obligations” is in reality a capital expenditure and should also be subtracted from cash flow. The traditional measure of cash flow (cash from operating activities less capital expenditures) doesn’t capture this item. With the acquisition of Whole Foods last year, this lease accounting shenanigan has become of greater importance as Amazon’s retail footprint gets larger. I’m baffled at the fact that people believe Amazon can simply expand into retail without facing the incremental costs of operating brick-and-mortar stores. Perhaps in the news articles sensationalizing employee-less stores with no cash registers, the writers forgot to mention Amazon would also be paying rent.

In real terms, the only difference between capital leases and operating leases is the ownership of the property at the termination of the lease term. However, during the term of the lease, capital leases are recognized as a liability on the balance sheet while operating leases are nowhere to be found. Operating leases are, in fact, a liability just like any other: a contractual set of payments for a set term. As a result, they should get the respect they deserve and be included as a liability on the balance sheet. This brings long-term obligations to $47.6 billion on earnings of $2.7 billion, a scary comparison.

Screen Shot 2018-07-18 at 11.47.20 PM

Putting it Together

Five years ago, these weren’t factors that warranted much attention, but recent developments have put these considerations on a pedestal. If we want to see true free cash flow- the amount of cash we can expect Amazon to produce irrespective of stock performance and other accounting games- then we must make these adjustments. Unfortunately, we do not have capital lease information for years prior to 2013 so I’m assuming its $0 (it’s not). Although not explicitly written, this calculation also includes SBC as an expense.

Screen Shot 2018-07-18 at 11.40.21 PM

Cumulatively, since 2008, Amazon, the darling of our generation, has produced a grand total of $834 million in actual FCF, less than cumulative FCF as calculated by Amazon and cumulative earnings. Interestingly, doing the same exercise we did above, average FCF for 2008-2010 was $983 million and average FCF for 2015-2017 was $214 million. So much for a company that is focused on “long-term, sustainable growth in free cash flows”. As we discussed before, the incremental value of a company is equal to the amount of cash it produces for its owners. However, during this same period, Amazon’s market capitalization has increased by an outstanding $862 billion, or more than 100 times the cash it produced for its owners. A stock may outperform a business in the short-run, but in the long run, history has shown us that stocks don’t outperform businesses. Finally, and I cannot stress this enough, there is no such thing as “the numbers won’t make sense. It’s a bet on the future.” By definition, the value of a business relies on two numbers: future cash flow and the discount rate.

Homes, Banks and Gaming (Portfolio Update)

As I mentioned in my previous post, there has been lots of activity in my portfolio, and for that reason I postponed my usual portfolio update at the end of my analysis on Aflac. This post will be solely dedicated to explaining the methodology of my portfolio as well as my rationale for many of my position, some of which don’t have separate posts dedicated to them.

Here is a snapshot of my portfolio as of today:

Screen Shot 2018-07-10 at 10.34.23 AM

The total cost of these position is $9,598 and their market value is $10,576 for a gain of approximately 10% thus far. This short-term gain (over the course of 2 months) does not excite me in the slightest. Tomorrow I may be drowning in red ink; the vacillations of the broader market (and consequently my stocks) do not interest me nor do I attempt to forecast my gain over any time period. You will oftentimes come across analyses that read like this: “84% upside realizable within 36 months”. I find these claims misleading and oftentimes downright wrong. The only claim I make with these businesses is that they will outperform the broader market over a period of many years.

I constructed this portfolio by going through a list of all stocks listed on American stock exchanges from A-Z. Within that world of thousands of companies, I picked the few great businesses whose financials and prospects appealed to me. As you can tell, I was completely agnostic to industry (hence the title of this post) and macroeconomic trends (I bought a Chinese stock despite trade war fears), electing instead to focus on the quality of the business relative to competitors. If a business convinced me that it would outperform its competitors in the future, then I bought it at a price that seemed reasonable to me. There were many companies I came across with indestructible business models (examples include AMZN, MA, V and FIVE), but these advantages came at a steep price. Someone I admire once said, “You can turn a great company into a bad investment if you pay too much for it.”

I also came across companies on the other side of the spectrum, companies which have questionable business models, a hazy future or bad management, but were selling at outrageously cheap prices. Examples of this breed include GME, YRD and LGIH. Rejecting these companies may seem contradictory to the tenants of value investing: buy companies worth $1 for 50 cents. For each of the aforementioned companies, their appraised value (appraised by me, for what it’s worth) were at least double current prices. To understand why I rejected these opportunities, consider this calculation.

Say you had $100 and magical capital allocation abilities and were able to earn a 50% return per annum; the catch is that you must sell your investments at the end of each year and pay 20% capital gains tax because your portfolio consists of mediocre but cheap companies, not long-term holdings. At the end of 20 years, you would have $3,833. If instead you didn’t sell your holdings (and therefore not pay capital gains tax), your $100 would be worth almost $333,000. In fact, to match the same return of someone who makes 50% per annum but pays capital gains tax every year, a long-term holder would only have to achieve a return of 20% per annum. A short-term 100% gain on a stock like GME may seem enticing, but the allegory of the tortoise and the hare always prevails: a long-term investor of great companies will always beat the short-term trader.

Now I’ll go more in depth into each of my holdings:

Bank of Internet (NASDAQ: BOFI)

Bank of Internet is an interesting company in that it has no branches. Typically, when you hear about a bank, you imagine your local Wells Fargo branch, but BOFI has almost $10 billion in assets while only managing one branch (which is mostly used for corporate activities). Based on my findings, Bank of Internet is the most profitable publicly listed bank in the United States. For the past five years, return on equity has averaged 18% and return on assets (the prime measure used to evaluate banks) averaged 1.6% and is growing. For reference, the average ROE for banks is about 11% and ROA less than 1%. A bank with a ROA of above 1% is considered very profitable and currently no traditional bank can manage an ROA of above 2% consistently in our current economic environment.

It’s easy to grow, a little harder to be profitable, but extremely difficult to have profitable growth, and this characterizes BOFI- over the past five years, total assets have grown almost two-fold from $3 billion to $10 billion, and the stock has risen in tandem. However, $10 billion in assets is still considered very small for banks, and BOFI’s structure allows it to grow much faster than traditional banks. Other banks (take Bank of Southern California or Bank of Florida) are limited to a certain geographical area, which puts a ceiling on their growth. Moreover, lower profitability is another laggard for growth. Bank of Internet has two things going for it. First, it is not limited to any geographical location, so a Californian uses its services just as a New Yorker. Instead of dominating in one market, it can take small pieces of many markets (after all, online banking, while a growing trend, is not something that can capture large market shares). Second, it has great leeway in operating expenses; that is, personnel expenses are limited. Total operating expenses for this bank are about a third of net revenues compared to a half at most other banks.

Many financial companies are priced based on book value, because, for the most part, their services and profitability are homogenous. Thus, BOFI’s price/book seems expensive; however, looking at the business from an earnings perspective, I get a 7.2% pre-tax yield on my investment. Still on the expensive side, but it’s not an outrageous price to pay for the best-run bank in the nation.

NVR Homes (NYSE: NVR) 

Imagine a company that’s in the business of making and selling homes but owns no homes or real estate for that matter. Imagine a company that provides loans for home-buyers but takes on zero credit risk. That’s NVR. NVR is the BOFI of the homebuilding industry. In other words, NVR is the most profitable home-builder of all publicly listed US home-builders.

There isn’t much to say about this company because the financials speak for themselves. I’ve highlighted the three “trouble years” for homebuilders as a result of the housing crash of 2008.

Screen Shot 2018-07-10 at 11.31.40 AM

During the worst housing crash in history, NVR’s return on equity fell to industry standards. While many companies went bankrupt and the ones who didn’t were reeling in losses, NVR was still reasonably profitable. I wish I wasn’t 8 years old when the crash happened, or I would’ve snagged my net worth’s worth of $500 NVR shares. More than that, the management has demonstrated excellent capital allocation skills (a keen eye would have noticed that the growth rate of EPS is much larger than that of sales). ROE for this upcoming year is estimated to be upwards of 50% while NVR employs little to no debt. This high profitability can be traced back to the company’s prudent strategy of using options to obtain rights to land. While other companies are stuck with purchased lots when housing prices decline, NVR is free from this risk. Moreover, NVR’s operations are concentrated in the east coast so there is plenty of room to grow into the West coast using this proprietary business model.

Signet Jewelers and Tractor Supply Company

You can find my analysis of SIG here and TSCO here. The important distinction I’d like to make is that of all my holdings, SIG is the only short-term holding. I believe the company’s value is $4-10 billion and its trading at around $3.5 billion (I bought it when it was trading at $2 billion).

YY.com

I left the most difficult thesis for last.

http://www.yy.com is a Chinese online live-streaming service (check it out yourself- click the link). On this website, you can live-stream practically anything from music/dancing to games. Needless to say, the merits of this business model lend themselves to handsome profitability. Live-streaming is all about viewership: if I’m guaranteed 100,000 users on YY verses 50,000 on another platform, YY will get my vote. It is also a self-reinforcing mechanism, the larger a service gets, the lower customer acquisition cost becomes. This is reflected in the financials, another case of profitable growth- except this growth is more dramatic. Revenue has grown from 1.8 billion yuan to almost 12 billion today and operating income from 476 million yuan to 2.7 billion yuan today. There is also reason to believe this trend will continue for at least the next few years. YY’s principal competitor is Tencent which offers its own live-streaming service. Nonetheless, this market is still in its nascent stages and there is a lot of “white-space” both these companies operate in. Furthermore, YY is the largest live streaming service in China so it has the largest competitive advantage in theory.

The opportunity to buy YY at an outrageously cheap price comes from an investment in a company called HUYA. HUYA is essentially the Twitch of China- it is a gaming live-streaming service. HUYA completed its IPO earlier this year in the mid-teens. Within a few weeks, its stock jumped to almost $50 and it now back down to low thirties. YY owns 48% of HUYA; Tencent owns approximately 30% and the other ~20% is traded freely by the public. HUYA’s market capitalization is about $6 billion while YY’s market capitalization is about $6.5 billion. Since YY owns about half of HUYA, it owns $3 billion; we can say that $3 billion of the $6.5 billion is HUYA and the remaining $3.5 billion is the residual value of the rest of YY’s business.

Quick accounting technicality: if company X owns over 50% of company Y, X is required to consolidate Y’s results into it’s financials. At the date of YY’s most recent F-20 report, it owned over 50% of HUYA, so HUYA’s results were included in revenue/earnings figures.

Separating HUYA’s financials from YY’s, we see that HUYA makes $336 million in revenue, and operates at a net loss of about $12.4 million. The market believes that is worth $6 billion AND almost half of YY’s total market capitalization. Since YY owns about half of HUYA, we subtract $168 million in revenue and add $6.2 million to its consolidated results. We are left with a company making $1.6 billion in revenues, netting $390 million. The market believes that this business is worth the residual value of $3.5 billion or less than 10 times earnings. In reality, the residual YY business is the number one player in a burgeoning industry. Not just that, but it’s extremely profitable with a return on equity of 27% while HUYA is earning a loss. The reality is that this company is worth a lot more than $3.5 billion. How much more depends on future growth, but you don’t need to know the exact value of a stock to know it’s cheap just like you don’t need to know the weight of a man to know he’s fat.

The reason the market is putting a low valuation on YY is because of an agreement with Tencent. Tencent wants to move into the gaming live-streaming industry, so YY agreed to give Tencent the option to purchase a portion of its stake in HUYA until Tencent’s stake reaches 50.1%. I think people believe that this option diminishes the value of YY’s stake in HUYA since the price that Tencent purchases HUYA shares from YY may not necessarily be the current market price. Moreover, accounting rules dictate that if HUYA is trading at, say $30 and Tencent buys shares for $20 from YY, that $10 is recorded as a loss on YY’s books even though there was no cash outflow. Despite these concerns, I think people didn’t read the fine print of this option. The following is an excerpt from YY’s 20-F report:

“The exercise price of the right was equal to the higher of (i) the price per ordinary share based on Huya’s post-money valuation upon the closing of the Transaction, and (ii) either (1) a per ordinary share issue price for the most recent qualified financing of Huya, if Huya has not then completed a qualified IPO at the time of Tencent’s exercise of such purchase right, or (2) the average of closing trading prices in the last 20 trading days prior to Huya’s and the Company’s receipt of Tencent’s written notice to exercise such purchase right, if Huya is then a public company.”

In layman terms, Tencent could basically buy shares of HUYA from YY at the average of HUYA’s trading price for the past 20 days. Today, that would be around $38 compared to HUYA’s stock price of $33. Tencent might get a small discount if there continues to be extreme volatility in HUYA’s stock (for example, if it were to increase 30% tomorrow, Tencent could still buy it at around $40), but the discount will most likely not be large enough to account for the huge discrepancy between price and value we are seeing in YY’s stock. Finally, this option only exists until Tencent owns 50.1% of HUYA stock; YY will still own about 30% after the option is exercised, so it will still be able to benefit from further appreciation of HUYA’s stock. Arguably, in Tencent’s control, HUYA will also be a much more valuable company/brand. Regardless of how you look at it- from a change in control perspective, an accounting perspective, or a residual business value perspective- YY seems extremely cheap in light of its business.


Aflac: My Favorite Duck

aflac-companyupdate-1520434949533In 1974, Aflac Inc. (NYSE: AFL) was the second supplemental life insurance provider to enter the Japanese market which was characterized with high government regulation. Subsequently, we witnessed two periods of deregulation, one in the 1980’s and another in the 2000’s. Thereafter, the market became highly competitive with over 19 providers in the late 1980’s itself; nonetheless, Aflac Japan remained on the forefront of this industry. Now, Aflac Japan still accounts for over two thirds of Aflac’s total revenue steam despite efforts to gain market share in the U.S. market. Aflac primarily operates in two major markets (U.S. and Japan) and generated over $18.5 billion net premiums during fiscal 2017, up from $13 billion a decade ago. The company almost exclusively invests in fixed-income securities with almost half of its invested concentrated in Japanese Government Bonds.

A Little Bit About Insurance

While insurance companies typically attempt to differentiate themselves through advertisement, insurance is fundamentally a commodity— as consumers, we look for the lowest possible price and rarely much more. For this reason, the industry is highly competitive, meaning most firms operate at marginal levels of profitability. When the industry as a whole is experiencing high profitability, inevitably firms begin to increase volume and drive rates back down into a loss. While an insurance policy is an impalpable good, the industry still suffers from the ravages of oversupply.

Under normal circumstances, the insurance industry as a whole typically operates under an underwriting loss. That is, premiums written typically do not cover benefits given and other operating expenses. What makes insurance companies profitable is the investment income earned over the life of a policy; if a company exhibits exception capital allocation skills, even a large underwriting loss can be mitigated through prudent investing. Because of the extraordinary role of capital allocation in the success of insurance companies, the person in charge of the investment portfolio is arguably the most important variable when appraising an insurance company.

When an insurance policy is written, payment is received upfront while benefits are deferred. Especially in the case of life insurance, benefits may be deferred for 20-30 years or not paid at all. During this period, the insurance company has a pool of investable premiums which should (ideally) cover the firm’s underwriting loss and produce a profit. We call this pool of funds “float”. As one can imagine, a company cannot invest these funds as it wishes— after all, it’s not free money and must eventually be paid. Therefore, a company must maintain sufficient liquidity to prevent insolvency in the case that many policies become due at once. Of course, a company ought to be diligent in underwriting to prevent systematic risk, but a low probability is still a possibility and a firm must be prepared for it.

If float is not free, then what is its cost? To answer this, we return to the underwriting loss. Many actuaries will underwrite policies that they know will produce a loss simply due the investable funds these policies will generate. In other words, losses are incurred for the sake of increasing float. Thus, we can view a company’s underwriting loss as the “cost of float”. In business, there is no free lunch. However, this scenario is beneficial if and only if the cost of float is less than the cost of obtaining other types of financing (i.e. debt or equity financing). This is a rare occurrence. For reference, both MetLife and Prudential both incurred a cost of float of over 5% in 2017 compared to the yield of the 10-year U.S. Treasury bond of ~3%. If an insurance company can consistently grow float at a low-cost relative to U.S. Treasury yields, then we have found ourselves a gem.

Aflac’s Float

 Aflac, however, does not suffer from this affliction. In fact, most recently, AFL’s cost of float has been less than 0%, that is, people pay Aflac to hold their money. The following chart illustrates this. Float is defined as policy liability— which is defined as future policy benefits plus unpaid premiums and unearned premiums less deferred policy acquisition costs and other prepaid expenses.Picture1

Aflac has never had to pay more than 2% for its investable float, and most recently, it has been paid to invest $90 billion while also accruing all the benefits from these investments (about a 5% yield). Nevertheless, all of this amount is recorded as a liability under GAAP rules; in reality, every dollar that is expected to be paid in benefits tomorrow is replaced with a dollar today. The true economic liability of this float, therefore, is far less than the amount written on the books. Instead, this pool of investable funds should be thought of as a revolving credit facility that is obtained at no cost. Most importantly, AFL has demonstrated a consistent trend of decreasing its cost of float from ~2% in 1997 to -1% today, and for half of the period presented, float has been obtained for free plus some.

If we take the average float from 1997-2002 and compare that to the average float from 2012-2017, it has grown from $22.6 billion to almost $82 billion for an average growth rate of ~6.5% per annum. If we assume a growth rate of 3% going forward, over the next five years, AFL will generate a float of about $104 billion. At a 1% profit (keeping in mind combined ratio has been declining over time), our underwriting profit would be on the order of $1.4 billion, or around $500 million incremental cash flows ($1.4 billion minus ~$900 million current underwriting profit) at absolutely no cost. It seems as if the market is missing this extremely useful competitive advantage surrounding Aflac, not to mention its propensity to produce cost-less earnings through a marginal increase in investment yields.

Unrealized Investment Gains

 Under GAAP accounting, only realized investment gains are recording in a company’s income statement. For example, if a company owns $1 billion in securities that appreciate to $2 billion, this accretion will not be accounted for in the income statement should the company not sell the securities. However, in terms of economic value, unrealized gains are equal in stature to realized gains. This discrepancy between what the company reports and what it “really earned” becomes very large when you have over $100 billion in securities.

Of course, unrealized gains are by their nature erratic. That is, if we were to add them to reported earnings, we would get very lumpy figures. In addition, future unrealized gains are, in part, dependent on the actions taken by portfolio managers today (if a company sells a security today, future gains are obviously not recorded anywhere). Despite these shortcomings, adding unrealized gains and losses to the reported earnings does provide a useful proxy to what the company “could’ve” produced in any given year. If unrealized gains and losses more or less equal, adding them to reported earnings will not change a thing. No harm, no foul. However, if an investment consistently appreciates or depreciates in value, the company not selling the security can shroud an otherwise higher or lower earnings figure. The following table attempts to create a “real investment income” by incorporating realized with unrealized gains and losses:

Picture2

Overall, there is a significant difference on the order of $700 million. If we add these new figures to underwriting profit, we obtain a larger pre-tax earnings figure.

Picture3

This result suggests a fair value for AFL on the order of $50 billion (~10X pre-tax income). This is, of course, assuming no growth. If we assume underwriting profit and investment income to increase by 3% every year (same as the float), then the intrinsic value of Aflac may be closer to $60 billion. And while I do not like (nor think I can accurately) making macroeconomic projections, this investment will fare well given a rise in interest rates, which corresponds to a rise in investment yields.

Portfolio Update Coming Soon…

Usually I insert an update on my portfolio here, but I’ve entered into more positions other than Aflac, but have not begun putting my thoughts down on paper. I will publish another post (hopefully within the month) containing a portfolio update. I will say that I initiated a position in Aflac about 3 weeks ago (about 10% weight), and my account currently stands at ~75% equities and 25% cash. Stay tuned for discussions of banks, insurance and more!


Every Investment Begins With Kay

Signet Jewelers (NYSE: SIG) is the world’s largest jewelry retail chain with three large segments— Sterling Jewelers, Zales and Jared— as well as a diamond polishing facility in Botswana. The company purchased Zales in 2015 for ~$1.3 billion with a combination of debt (~$700 million) and securitized accounts receivable (~$600 million). Since 2010, the company has earned about 25% on equity capital on a pre-tax basis (about 20% after-tax) while utilizing little debt. Additionally, since 2010, SIG doubled its revenue and operating earnings. Since 2015, SIG has been in somewhat of a rough patch on two fronts: the courts and in the stores. It has been exposed to litigation on the basis that it allegedly engages in wage discrimination and other gender-discriminatory practices, quality control in regard to diamond repair is lacking and extends credit to customers whom can’t pay, temporarily inflating its accounts receivable. In the stores, revenue has declined ~6% since 2015, from ~$6.4 billion to a projected $6 billion in 2019. As a result of these problems, the stock has fallen from a high of $160 to its current price of $38.

I bought SIG because it affords a substantial margin of safety. In 2010, the company had an operating income of $250 million, so we can conceive a conservative fair value on the order of $2-3 billion at that time. This is not taking into account the company’s high profitability and run-way for growth over the next eight years. For a company earning 25% pre-tax on equity capital, I would be willing to pay upwards of $5 billion for the firm in the current economic environment. Now, to prevent the ravages of using an artificially low number to begin with and artificially high number to end with (which, unsurprisingly so, many analysts forget), we take the average pre-tax earnings of 2009-2011 and compare that to the average from 2016-2018 (2018 corresponds to fiscal 2017 in SIG’s financials). Operating income grew from $250 million to slightly over $500 million with little change in profitability. During this time, the company has aggressively repurchased shares, almost tripling earnings per share from ~$2 to $7. During this time, I would argue that the company’s intrinsic value at least doubled to something on the order of $4-10 billion. If we can accept that the company’s actual fair value is the midpoint of this range, $7 billion, this translates to a share price of $121. The weighted average price of share repurchases since 2013 has been ~$60, so we can say the company created extra value through this program.

The two main problems we face now are (1) litigation and (2) recent performance of stores. I will tackle (2) first because it is easier. The answer is simply we’ve protected ourselves with our margin of safety. If we look at SIG’s valuation metrics, the average P/E ratio has been 18, which translates to ~12 pre-tax (the company actually pays much less than 35% tax since its incorporated in Bermuda which garners certain tax advantages). Nonetheless, it is currently trading at 5 times its pre-tax earnings. If we accept the above valuation, Signet’s average earnings can fall 50% before intrinsic value falls below the current market value. Realistically, if we forecast the trend of the past three years into the next five years, pre-tax income will not fall below $500 million. However, the company is engaging in a transformation, dubbed as the “Path to Brilliance” by the new CEO. Under this plan, the company will close down 200 stores and open another 35-40 to prevent cross-store competition (how many malls have a Jared and a Kay Jewelers?) and reduce mall exposure. In addition, the company has outsourced its accounts receivable (more on this later) at a discounted rate to ADS (prime) and CarVal Investors (subprime). These major initiatives will result in red ink during 2019 but a leaner, safer operation going forward. While I’m naturally skeptical about “transformations, turnarounds and restructurings”, I do not think they will result in an 50% decrease in average earnings for the next five years. If anything, this Path to Brilliance may drop earnings from an average of ~$600 million to $400 million, and SIG’s current ridiculously low valuation protects us from this drop in fair value.

This brings us to litigation. First and foremost, current and former works have filed complaints against Sterling Jewelers alleging wage discrimination and sexual harassment in the workplace. I will tackle this point from two points of views. For the investor point of view, the question of paramount importance is, “Will this affect SIG’s long-term earnings power?” The answer is a flat no. Litigation can potentially result in a one-time fee/settlement, but this is unlikely to persist in the future. In addition, this suit was brought upon about 250 women. While litigation surrounding sexual harassment can tarnish the reputation of a company built upon serving relationships, this is far too small to cause meaningful disruption in the business. In fact, for the two years this has been going on, revenues have only slightly declined, and this was not a result of negative sentiment surrounding the brand.

From a sensible person’s point of view, we must ask, “Is this toxic culture something that will persist in the future?” One should simply read this Washington Post article for examples of some truly repulsive acts committed by certain Sterling managers. Editorializing a bit, regardless of a company’s position in the courts, even one case of sexual harassment ought to be taken seriously by senior management and appropriate steps must be taken to alleviate the situation. Especially in a company as large as Signet, there is bound to be an employee who steps out of ethical lines at some point. In this sense, I believe SIG is putting its best foot forward. For one, Mark Light, the company’s former CEO and someone who allegedly was involved in certain of these acts, has stepped down (although the reason appears to be health related). Regardless, Virginia Drosos has taken over and half of SIG’s board of directors now consist of women. While it is too early to determine the result of litigation and actions by senior management, the picture looks promising.

Back to the investment case, the second serious allegation against SIG is that the company is essentially extending credit to those who cannot pay. Aside from the societal harm, this practice creates an artificially high accounts receivable, money that people on credit owe the company but have not paid yet. The implications are financials that appear strong but, in reality, are tenuous, and this poses a real problem for forecasting. Indeed, if accounts receivable are dubious, then our assumption of $500 million average operating earnings going forward would be invalid. Going back 10 years, however, it is easy for us to make accurate predictions as to the collectability of accounts receivable going forward by comparing charge-offs to the full account. Over time, charge-offs (money that is 120 days past due and thus deemed uncollectable) averaged a little over 10% of receivables. As a result, going forward we can slightly less than 90% of receivables to be collectable, which is not bad. To make things better, SIG recently began outsourcing its accounts receivable and sold its receivables account as of 2018 to ADS and CarVal Investors. The implication of this is that SIG will be collecting less receivables, but the upside is reduced credit risk which should further solidify future profitability.

Portfolio Update

Screen Shot 2018-05-14 at 10.57.01 AM

I purchased SIG this morning for about 10% allocation. You will notice that my portfolio still consists mostly of cash (70%), and this is likely to remain so until I find more opportunities. Its far better to sit on a golden egg than ask someone to hold it.

I should also note that my confidence in IBM is not as strong as my previous article implied. Alas, a drawback of stock pitch competitions is that you must pretend you have 100% conviction in an idea. On the topic of portfolio management, one should weigh opportunity cost when deciding between investments. My current opportunity cost is US Treasuries, which yield ~3% (10-year), so any opportunity that affords me >3% return with limited downside is eligible for investment. IBM is aggressively repurchasing shares (4% per year) and has a 4% dividend yield. The stock is also extremely cheap and, in my opinion, at least a 40% discount to intrinsic value. The lack of 100% conviction stems on the sustainability of IBM’s earning power. We have already seen the ravages of competition on IBM’s earnings over the past half-decade. If this continues, we may see IBM’s intrinsic value fall under its market value. However, I think this possibility is remote, and in the meantime, I’m enjoying a good return from dividends and share repurchases.


International Business Machines: Blue Skies for Big Blue

Disclaimer: I worked on this pitch with my colleagues James Rao, Preston Ching and Kevin Lu from the Wharton School for a stock pitch competition. For reference, here are their emails: jdrao@wharton.upenn.edu, kevinlawrencelu@gmail.com and cyjpres@sas.upenn.edu. Credits for the title of this post go to James. 

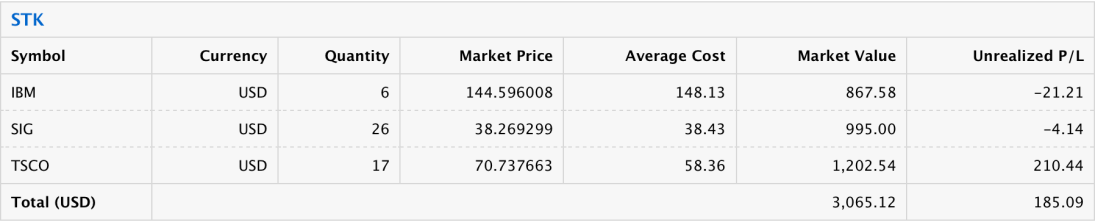
In my last post, I mentioned that I purchased a stake in IBM (~10% of my portfolio), but I don’t think I gave a convincing rationale. This post serves to fill in that gap, explaining my rationale for purchasing IBM a few months ago.

Company Description

What is IBM? The most common answer is a multinational technological giant. Those who have followed the company more closely may add it has significant mainframe, hardware, and software products. But today’s IBM is increasingly positioned as an as-a-service (aaS) provider and within the next decade, its business model will primarily be in a new wave of technological strategic imperatives, CAMS: Cloud, Analytics, Mobile, Security and Social. Cloud computing, a method of storing and working with data, is increasingly on the rise due to the easier accessibility and transferability. Analytics services utilize big data- representative of vital value chain activities like procurement, management, and scale- to make evidence-based business decisions. Mobile solutions bring together IBM’s versatile technologies to accelerate business initiatives and drive digital innovation. Security in an increasingly dangerous world is vital to protect business insights and proprietary property, and collaborative solutions are necessary in an interconnected world. IBM operates under five business segments (Exhibit B). Cognitive Solutions leverages the power of AI to create meaningful applications for businesses; Global Business Services provides consulting and management services to clients; Technology Services and Cloud Platforms provides infrastructure services; Systems focuses on providing hardware and operating systems; and Global Financing deals with payment plans, reselling of used equipment and financing.

In 2017, IBM’s strategic imperatives represented 46% of overall revenue with growth of 11% to take up almost half of IBM’s overall revenue. This halfway point suggests IBM is quickly reaching an inflection point from its current transition period, having redefined its core strengths and business segments. The fundamental underlying business model change has been from products to services. Before, IBM sold on-premise hardware or goods that their customers had complete ownership of. Now, IBM, like many other companies and industries in an increasingly rent-based, sharing economy, has focused on annuity services based on subscription models. IBM’s continued strength in forming partnerships with other tech and industry-focused players, as well as its role as an integrated service provider, will accelerate its transformation in a changing world.

Summary of Investment Thesis

In 2010, IBM’s CEO, Sam Palmisano, set an EPS target of $20 by 2015. It was amid a time of declining revenues and public scrutiny surrounding IBM’s implementation of new turnaround strategies to reposition the historic tech firm in an increasingly disrupted world. Over the years, enthusiasm waned as investor fatigue began to set in after quarters of deteriorating top-line numbers. We believe this sentiment was augmented recently as Warren Buffet exited his position in IBM, citing “big competitors”. Today, despite revenue growth in the fourth quarter of last year and nearly half its business coming from its new ‘strategic imperatives, IBM is trading at historically low multiples. We believe investors have grown tired and abandoned the stock right at the moment when IBM is beginning to show the greatest signs of resurging strength.

“Cloud computing” and “artificial intelligence” have become buzzwords of modern society, but few understand the underlying meaning of these terms. We believe that this lack of understanding characterizes the investor sentiment regarding the prospects of IBM. After researching the technology behind this seeming transformation of the IT industry, it becomes apparent that IBM is far from lagging behind other competitors like Amazon Web Services (AWS) and Microsoft. In addition, when a company is radically changing its suite of products, the past record is not a good indicator of future prospects; therefore, we do not endorse the strategy of many analysts of projecting past trends into the future. Instead, our thesis comprises of three major segments: (1) Contrary to public opinion, IBM is actually a leader in the new cloud computing space and figures suggest that this cloud revenue is more accretive to value than that of other cloud vendors like AWS, (2) IBM’s legacy business is an asset rather than a liability since large legacy clients provide a ready market for IBM’s new suite of services and (3) the as-a-Service fee structure and off-premise offerings provide both predictable annuity revenue and lower costs of operation that will drive value for the long term.

Firstly, anecdotal evidence and comparisons with other firms suggests that the market is not valuing IBM the same way it values other players in this space, despite the fact that IBM is a leader in the cloud computing space with cloud revenues over four times that of its next largest competitor, Google. Secondly, those who do not understand that not all cloud revenue is created equal will fail to understand that while a company like AWS has a higher market share, IBM actually has a larger presence in the enterprise-focused, stickier PaaS and SaaS segments of the market. Thirdly, the investment community exaggerates the decline in IBM’s legacy business but fails to acknowledge that the mainframe is still a very integral aspect of the industry and we are merely witnessing its commoditization rather than its demise.

What’s better than having the first-mover advantage? Already having a captive market, and this is exactly what IBM’s legacy business provides. IBM’s long-time clients- large, established companies with mission-critical systems hosted on IBM’s systems in integral industries- are all economically more receptive to staying with IBM. In addition, the trend towards the “hybrid cloud” further increases switching costs for legacy customers because they will be utilizing IBM services both on-premise and off-premise. In fact, on their most recent earnings call, management expressed enthusiasm in moving IBM’s entire $120bn backlog to the cloud.

Finally, many investors cite lowering service revenues and transactional revenues as reasons to exit IBM. On the contrary, this is exactly what we’d expect from a company undergoing a change from providing on-premise services to remote services. Previously, IBM would sell hardware/license software and provide continual maintenance services to its clients; now, all the maintenance is done in-house leading to a decline in service revenue. However, this change results in increased annuity-based revenue which is more predictable and sustainable than the company’s legacy business.

To reiterate, what led us to believe that IBM is undervalued on the basis of a misunderstanding in the market was the fact that many assets for IBM are currently considered as liabilities by the investment community. This is reflected in the current valuation of IBM relative to its direct peers (like Oracle and SAP SE). Our valuation based not on the past record but on predictions about the future of this industry suggests a 65% upside for IBM. We believe our valuation was based on modest estimates regarding the future of the industry and IBM’s respective market share thereof. In addition, this analysis does not include the effect of share repurchases and dividends (current dividend yield is about 4%). These factors suggest even a larger upside for IBM over the next 3-5 years.

Industry Overview (Cloud Computing)

Our story begins in 2002, when the so-called “IT Sector” began to conflate two breeds of IT companies: the consumer-goods companies (Lenovo, Microsoft, Hitachi, etc.) and the enterprise-focused firms (Oracle, SAP SE, etc.) Traditionally, all IT companies serviced both segments of the industry; in fact, IBM itself had a Personal Computing (PC) division and hard disk division. In these consumer-goods markets margins were razor-thin, and companies essentially competed on price. Moreover, the development of technology burgeoned the commoditization of these products to the point where a once lucrative growth opportunity devolved into a perfectly competitive one. Therefore, IBM elected to be the latter, sold its hard drive and PC businesses (to Hitachi and Lenovo in 2002 and 2005, respectively), and a transformation ensued. Prior to this, IT solutions were simply another “product” companies would buy. Samuel J. Palmisano, the CEO at the time, coined the term “On-Demand Businesses”. In essence, these businesses did not operate in a transactional nature; they expected their IT solutions to improve the underlying business itself, from supply-chain procurement to data integration. Increasingly, enterprise-focused IT companies became consultants (in fact, Services made up half of IBM’s revenue for the latter part of the last decade). While radical changes have occurred since the early 2000s, they can all be traced back to the concept of On-Demand Businesses- specifically, businesses never wanted to wait for IT services; rather, they wanted IT services to continually be molded into the daily operations of the company. To this end, the majority of IBM’s Service contracts are a combination of each segment.

More recently, a new trend has taken hold: the diversion from hardware altogether. IBM had early success with its various operating systems (in particular, its xSystems and Blade); however, clients soon realized that on premise IT servers were cost-ineffective. To use an analogy, a college graduate with the option to rent an apartment or buy a house will most likely rent an apartment. An on-premise server(s) is akin to buying a house, and property taxes, utilities, and lawn-mowing expenses for houses are analogous to cooling systems, IT departments and server maintenance for on-premise systems. Continuing with the analogy, wealthy/older individuals are the only ones who could afford houses, even mansions. Naturally, on-premise systems are only cost-effective to the largest companies with the highest volumes; however, they were the only option for a long time as companies had no way to outsource their physically large servers. Enter cloud computing: the ability to rent IT services from a cloud vendor. Cloud computing comes in three flavors: Infrastructure-as-a-Service (IaaS), the most basic data storage systems; Platform-as-a-Service (PaaS), platforms or operating systems to build applications upon; and Software-as-a-Service (SaaS), actual applications, both general and industry specific, for clients to leverage. However, these are not separate offerings; rather, they’re a tiered-system. For example, a client cannot leverage applications produced by IBM without first housing its data on IBM servers- as a result, these offerings are not of equal quality. Instead, they are ranked in order of stickiness: it is easy for a company to move its data from Oracle to IBM but difficult to use another vendor’s applications as this would require worker retraining and a temporary shut-down of operations.

When comparing different firms in the cloud computing space, this realization is critical. To begin, when asked “Who are the top three cloud vendors?” most industry professionals respond, “AWS, Microsoft and Google.” While it is true that Microsoft and Amazon Web Services hold the top two positions, respectively, Google actually ranks 4th. The real standings, notwithstanding the fact that cloud revenues are difficult to measure in their current state, are Microsoft ($20.4bn run-rate), AWS ($18bn run-rate), IBM ($17bn run-rate) and Google ($4bn). It is apparent by this comparison that this industry has three large leaders, but even this is not the correct way of viewing this space. AWS focuses almost exclusively on IaaS, running virtually no applications for its clients, while IBM focuses on offering a suite of services (as aforementioned, most contracts cover all segments). Moreover, AWS services the smaller breed of corporation, so it is difficult to make the comparison with IBM, whose clients mainly include large companies in the financial sector. Additionally, Microsoft is, at its core, a consumer goods business and as we discussed, it is becoming increasingly difficult to service both enterprises and consumers considering the commoditization of various technologies. If this is the case, then why has IBM been given such a dismal future by the investment community?

Well, in the past, IBM has been the undisputed leader in the mainframe business- to this end, every business hosting mission-critical systems would have utilized IBM servers. Therefore, a large portion of IBM’s revenue base consisted of this legacy business that once was the norm; since other companies had less reliance on this business (for example, AWS never sold mainframes), they found it easier to switch to the new model than IBM. However, a large reason why the adoption of the as-a-Service model hasn’t been stronger is because of the reluctance to move on-premise systems onto the cloud. The main concern clients have regards security, and while this reluctance has been tempered somewhat in recent years, it is likely to remain a paramount issue. In fact, mainframes still remain the preferred method of running mission-critical systems. According to the State of the Mainframe 2017 Report, over 60% of organizations report that they have no plans to discontinue using the mainframe while over 70% plan to stay on the mainframe for upwards of 6 years. According to the same report, almost 74% of CEO’s reported that mainframes were “very important” in performing large-scale transaction processing on mission-critical systems. Clearly, the “switch to the cloud” is not as pronounced as indicated by the literature and media coverage on the issue. The real widespread issue here is the adoption of the “connected mainframe”, that is, an on-premise server, albeit smaller, that leverages the security/privacy advantages of being on-premise while also enjoying the benefits of off-premise as-a-Service functionality. The term to coin here is the “hybrid cloud”, essentially a conflation of utilizing the services of a cloud vendor while still hosting certain sensitive data on a private cloud. The adoption of this is startling- according to RightScale’s State of the Cloud 2018 Report, 81% of CEO’s admit to utilizing some form of the hybrid cloud.

The problem here, as in the past, will be the commoditization of the mainframe. As the importance of an on-premise mainframe diminishes to simply holding sensitive data, companies will have less incentive to upgrade to new IBM products. For example, back in 2003, IBM introduced its Blade servers as part of its xSystems- rest assured, xSystems enjoyed dramatic growth over the next few years as companies replaced their “outdated” systems with this new technology. We believe that this is not likely to happen in the future, and investments in creating state-of-the-art software will likely not produce a favorable return on investment. However, history has shown us that IBM is not in the commodity business- seeing some sort of divestiture/sale in the future is not a remote possibility and such an event will bolster investor confidence if not yield direct monetary value.

Industry Overview (Artificial Intelligence)

It was the moment of truth. IBM’s Grand Challenge project of putting in a computer called Watson against Jeopardy legends was finally being aired on television screens across America. And Watson gave them a show, handily beating the other contestants with $77,147. But Watson, and the greater AI industry, will be worth many times more those winnings in coming years.

IBM’s Watson was one of the first significant forays into AI by a blue-chip tech company and with that, IBM gained a natural first-mover advantage. Powered by their underlying DeepQA software architecture, Watson was a heavyweight in what was, at that time, a small world. However, the tides of change have come, and increasingly, the AI space is more competitive. There are smaller AI platform start-ups backed by large venture capital firms looking to gain a share of what is a fast-growing, high-margin business. There are also the perennial tech companies like Amazon, Microsoft, and Google which are building out their AI software and platforms. This may represent increasing competition and put pricing pressures on IBM’s current AI business model. Nonetheless, out of all of these, IBM’s Watson has been able to maintain strong brand recognition and reputation, as well as a broad portfolio of services to provide.

But why did IBM choose to display Watson on Jeopardy? This was a very conscious decision on the part of IBM management- it is very easy to create a computer that can answer trivia questions, but extremely difficult to create one that can handle what in tech lingo is called “natural language”. Here is a sample Jeopardy question: A porch adjoining a building, like where Mummy often served tea. To begin, this is not even a question; to make matters harder for a computer, the answer is not “Terrace” but “What is a terrace?” Finally, the answer depends on our human experiences or what we expect would happen under certain circumstances. What makes AI different from a computer is the ability to “learn” from questions like these, similar to how a baby learns a language. More than that, AI can decipher unstructured data, that is, data that isn’t organized into an excel sheet. Some examples include doctor dictations, handwritten notes and images. It is estimated that over 90% of all the data on the internet is unstructured, giving AI a large potential market.

The nature of feeding highly sensitized and private competitive data to third-party AI tech will provide an economic moat to IBM Watson against both fragmented startups and the larger FAANG tech players. Significant portions of their future growth will come from Watson’s Internet of Things (IoT) in which IBM has made a $3 billion commitment. According to IDC, global spending on IoT will reach $772.5B by this year, an increase of 14.6%. This strong industry growth is driven by increasing enterprise adoption, with Gartner reporting that by 2020, 65% of enterprises will have adopted IoT products. Exhibit C1 shows the areas most likely to have the hottest growth, while Exhibit C2 displays IBM’s competitive landscape advantage in capabilities and strategies as an industry leader. Currently, it’s considerably crowded and fragmented in IoT platform services, but over time, only the larger players able to maintain profitability will survive, benefitting incumbents like IBM. While to most onlookers, it seems that IBM is too outdated; the reality is that IBM Watson is actually known for its most comprehensive and widest set of uses and abilities. In AI, initial data input is essential to train the computer algorithms and programs effectively, and IBM’s considerable head start and pre-existing partnerships with major Fortune 500 companies will prove to be vital in gaining executives’ trust in handing over these private data sets, especially given IBM’s increasing strength in cybersecurity.

In 2015, only one healthcare organization used IBM Watson Health for oncology, but by 2016, there were eight. Now, the technology has been deployed across 155 hospitals and organizations and diagnosis capabilities have dramatically increased as well, serving 147,000 patients, according to Watson Health General Manager Deborah DiSanzo. In a healthcare industry defined by stringent regulations on patient privacy and information protection, IBM’s reputation for both cybersecurity and trusted partnerships will be essential in convincing companies to release their data. Large healthcare organizations are well known for their conservatism toward technology, and IBM still does well in marketing itself outward to other executives and IT managers. IBM requires critical data input synergies to run AI platforms like Watson effectively. The more time and instances an AI program is used, the better it is in providing solutions; in other words, a built-in sustainable competitive advantage. Watson’s progression over different versions is showcased in Exhibit C3, drawn from a 2012 presentation that Watson has likely continued to make advancements since. Their recent acquisition of Truven Health Analytics will provide further information advantages by expanding their database to 300 million patients and double IBM Watson’s employee numbers (Truven previously used data analytics to help players in the healthcare industry reduce costs). All of this leads to why IBM officials have said that Watson is “a big part of our growth in overall analytics which was $17 billion last year” (Earnings Call).

When it comes to AI, the name of the game is data. A company can have the most sophisticated machine learning algorithms, but these are generally unhelpful without the input of massive amounts of data. Take the simple example of Amazon’s Alexa which is widely recognized to have the most advanced voice recognition in the world- while the technology behind Alexa is simple compared to other voice recognition systems, Amazon’s scale gives it access to large datasets that make Alexa more powerful by the second. Another consumer example is Apple’s Siri- while Siri seemingly gets “better” with every new iPhone, the technology behind this AI system changes little, if at all. Additionally, many AI platforms (including Watson to some degree) are open source, making “proprietary technology” hardly a differentiating competitive advantage. After consulting with machine learning experts at the University of Pennsylvania, we came to the conclusion that a company with little access to data will never win in the AI market. This implies that the big winners in the AI world will not be small technology start-ups; rather, it will be those with the greatest access to data: Amazon’s Alexa, Microsoft’s Cortana, Google’s DeepMind and IBM’s Watson. Of all these, it is generally accepted by experts that Watson offers the most comprehensive suite of services in the industry. This realization also sheds light on the reasoning behind many of IBM’s recent acquisitions. IBM’s major problem has always been little access to data, and this was a direct result of the company electing to be enterprise-focused. To use a comparison, Amazon owns the data of the millions of shoppers that visit www.amazon.com every day; however, IBM is locked away from the data gathered by airlines, credit card companies, etc. because it is a third-party vendor with no direct access to consumer channels itself. To mitigate this, IBM has purchased companies solely for the data they provide- examples include Truven with millions of medical images and The Weather Channel in 2014. Each acquisition brings IBM closer to bridging the gap between the industry-known sophisticated architecture of Watson and the breadth of data gathered by its clients.

Comparisons

What we’ve established thus far is that the reality of this industry is construed by the headlines we see on financial reporting services, and the numbers IBM has shown do not necessarily reflect a poorly run business as much as they reflect a changing industry. To reiterate, IBM was the largest (and some may say only) player in the enterprise-focused IT solutions space before the entrance of cloud computing and artificial intelligence- rebalancing operations to meet with these changing needs requires considerable time and investment; moreover, there are other players in this space. While it is difficult to compare IBM to Amazon and Microsoft since the latter two do not report unconsolidated figures other than revenue for their cloud segments, we can compare IBM to two of its direct competitors: Oracle and SAP SE.

For our comparison, we use figures for the previous ten years using three metrics: operating margin, return on invested capital (defined as net income into the sum of debt and equity) and return on equity (defined as net income into shareholder’s equity). Both IBM and Oracle display a favorable showing during the period 2010-2013 due to the economy coming out of a recession; SAP does not display the same trend, most likely as a result of its operations being mostly based in other countries. After 2013, all companies display a downwards trend; however, as expected, the trend is more pronounced in IBM’s numbers due to its being a leader in the legacy business. Looking solely at operating margin, we see that Oracle has the highest and steadiest showing with an average margin of 36% for the period presented, relative to 24% for SAP and 19% for IBM. Bringing returns into this picture, however, a contradictory picture emerges. Oracle has the lowest ROIC of 14%, followed by 17% for SAP and 29% for IBM. Looking at ROE, IBM again takes the lead with a 38% average ROE for the period presented, followed by 20% for Oracle and 19% for SAP. While IBM does have a larger debt burden than both of its comparisons, it takes the #1 spot in both ROIC and ROE, leading us to conclude that IBM is more profitable relative to its competitors despite lowering margins and declines in earnings.

The theme in this piece is a changing industry; in a changing industry, the past record is not as useful as we’d like it to be in predicting future performance. In this regard, trend is as important as absolute numbers. For all three companies, we define the trend by comparing the average metric from 2008-2010 to that from 2015-2017. For all three companies, the trend in operating income has been relatively stable, but the trend for the other two metrics have been severe. For IBM, ROIC has dropped from 32% to 20% and ROE has dropped from 43% to 25%. For Oracle, ROIC dropped from 16% to 10% and ROE dropped from 23% to 14%. For SAP, ROIC dropped from 20% to 12% and ROE dropped from 22% to 14%. We attribute this widespread decline in profitability to the tech-shock that we have been referring to; unless a company operated purely in the cloud computing segment, it was hit by this dramatic shift. For example, Salesforce, which operated almost exclusively in the SaaS segment, did not display this trend. Thus, we can expect this trend to reverse as these new technologies become a larger part of their revenue base. For IBM in particular, “strategic imperatives”- the name given to these technologies- just began to comprise half of IBM’s total revenues (in stark contrast to prevailing investor sentiment that cloud computing makes up a relatively small portion of IBM’s total revenues, we should add). What confounds us, however, is the relative valuations of these companies. While IBM has displayed a similar trend of deteriorating profitability, it still holds industry leading metrics, yet its valuation does not reflect this fact. The 5-year average P/E ratio for SAP SE is about 25.6, Oracle 20.5 and IBM 12.3. We attribute these differences to the lack of understanding of IBM’s competitive position- when a company shows declining revenues for six years, people begin to stop believing in future prospects, however fruitful. In addition, IBM is the oldest of the three companies presented, and we do believe there is a stigma of IBM being “stuck in its old ways” which disregards the fact that the numbers prove otherwise.

Key Value Drivers

Rather than focusing on increasing aggregate cloud revenue, IBM is focused on improving the quality of cloud revenue. We inquired on www.ibm.com’s live chat with a sales representative, “Our company would like to outsource our data storage systems using your servers. Can we please have pricing on your IaaS offerings?” Their reply: “Let me connect you with a specialist who will explain to you the different packages we offer to leverage both our servers and platforms for your company at the same low cost.” Unlike other major players in this field, IBM is focused on improving its PaaS and SaaS growth on top of basic data storage solutions with an as-a-Service run-rate of over 12% of total revenues. This increases the stickiness of IBM products, keeping with its legacy strategy. Previously, it wasn’t cloud solutions or AI-enabled applications but mainframe systems and software licenses; nevertheless, the strategy has remained the same: increase switching costs for clients. In addition, different offerings have different competitors; for example, the IaaS space has intense competition with AWS and other larger firms while SaaS has competition with smaller players like Salesforce. This is favorable for IBM for the reasons aforementioned regarding data.

Entrenched relationships with large clients gives IBM a ready market for new services. In addition to the size and volume of clients that used IBM’s legacy business, the type of clients also matters. For example, a retail company might find it easier than an insurance company to switch cloud vendors because it is easy for the retail company to retrain workers with new technology. The majority of IBM’s revenue (~30%) comes from the financial sector (financial services, banking and insurance) who find it easier to stay with IBM because of trust, cost, etc. Secondly, while IBM’s business has been derided in the media, its products have not. IBM products are still the standard for the industry: to quote an industry analyst in the technology sector, “if you’re running a family business, of course you’ll wanna switch to AWS IaaS because it costs less. But if you’re launching a rocket, you better hope you’re running IBM systems if you don’t want it to fail.” Finally, switching costs are directly correlated with the size of a company; considering that IBM primarily services larger enterprises, this correlation is very favorable for IBM.

Increased annuity revenue drives predictable revenue. In 2013, Adobe switched its licensing fee model to a subscription model- while subscribers were angry at the switch, the company performed phenomenally. A similar switch away from transaction-based revenue is occurring in the technology industry, and, in particular, IBM. Previously, IBM would license software to clients: this would be a one-time transaction which included software, specialized hardware, middleware, etc. However, now the company is switching to a pay-as-you-go model, evidenced by the rise in as-a-Service revenue as a percentage of total revenue. While this necessarily decreases transactional revenue, and to a large extent, service revenue, it dramatically increases the more favorable annuity-based revenue which is more predictable.

Recent acquisitions in data-heavy companies fortify the abilities of the Watson platform. If you look through a list of IBM acquisitions for the past five years, you will realize that in the past, IBM focused on increasing its data capabilities. Now, its focused on increasing its data through acquisitions of lateral companies. This is most apparent in IBM’s foray into the healthcare industry, where over 80% of data consists of unstructured physician notes, medical images, etc. Anecdotal evidence suggests that AI in healthcare can increase the ability of doctor’s to accurately diagnose rare diseases. More notably, data mining can create ways to reduce costs in this notoriously cost-ineffective industry. In this space, the most recent acquisition was that of Truven Health Analytics (2016), which has access to millions of medical radiology images to feed into Watson; in 2015, the company acquired Explorys, Phytel and Merge Healthcare, all companies that will leverage the power of Watson to create efficiencies for healthcare providers and payers. Another lateral acquisition was The Weather Company in 2014, giving Watson access to weather data across decades. Given the sophistication of the Watson platform and the speed at which it can decipher unstructured data, these acquisitions greatly enhance the competitive advantages of the Watson platform.

Opportunities and Risks

Opportunities:

Tech partnering instead of price competition: Many of IBM’s nascent business segments are in industries where there can be a high element of mission-critical cooperation. Various platforms, software, and hardware can be partnered together to create higher value to clients and drive future growth. This provides an opportunity for IBM to collaborate with other tech companies to generate market synergies and grow the overall economic pie rather than become stuck in detrimental price competition. Especially for high-innovation tech industries, it can be much more important to work together to drive a higher overall adoption rate and gain public acceptance and awareness. Reaching an inflection point for AI, cloud, and other industries’ adoption would be vital to all the players involved. We have reason to believe IBM is planning to utilize this potential opportunity, given that they emphasized partnerships with SAP Hana and Apple Core ML at their recent 2018 IBM Think Conference. Finally, since 2003, IBM has emphasized its dedication to open source technologies which burgeons the industry as a whole.

Accelerating Growth in New Trends: IBM’s bets on less well-known technological trends could pay off in the long-term as possibilities such as block-chain and quantum computing move into a larger marketplace and demand grows for these services. Many developers in financial services are considering using IBM’s platform for the growing “blockchain-as-a-service” market. This, too, involves collaboration in open source software and providing forums like Slack channels for developers to exchange ideas and build stronger human capital.

Emphasis on Cybersecurity: Cyber-crime damages are predicted to reach $6 trillion annually by 2021. With the growing risk of data breaches and cyber hacks, companies may refocus even more emphasis on data security and protection. IBM has a strong reputation for software security and with that recognition, they could have the most to gain compared to some of their competitors. IBM’s security is well-integrated into their platforms and their securities business within strategic imperatives is growing the fastest and may only accelerate in increasingly unsafe times.

Risks:

Too Much Marketing, Too Little Return: It is our opinion that IBM is currently overspending on promotion for Watson. In fact, in its most recent earnings release and call, the word Watson was mentioned at least 200 times; in addition, Watson was the focus of IBM’s recent THINK conference. If Watson does not perform as we hope or as quick as we assume in our model, our valuation and the reputation of IBM may both be affected. In addition, if IBM decides to divest Watson because of poor performance, then over $17bn of development over the past five years will have been in vain. Finally, the more resources that are spent advertising the platform, the less resources are being used to further develop it against competitors or compliment it with strategic acquisitions.

HR Recruiting Disadvantage: In an industry where tech firms compete for the best programming and scientist talent, IBM may still not be known as an enticing place to work for engaged millennial workers. This may require them to miss out on better employees or pay a premium for the same quality of talent. However, they have mitigated this by dramatically shifting the age demographics of their current workforce. Over the past five years, they have phased out more than 20,000 of their American employees who are ages 40 and over, bringing in younger talent with more nuanced understandings of IBM’s new business model segments. These younger employees will mitigate IBM’s current human capital deficit as IBM continues to redefine and turnaround its brand.

Over-Optimistic Industry Forecasts: In tech, there tends to be over-optimistic forecasts on just how quickly new emerging markets are growing. For example, Bluetooth technology was projected to grow very dramatically for many years. While it did eventually reach an inflection point of heavier adoption, many of these forecasts were later adjusted downwards. While IBM is well-positioned in technological segments that will be prominent over the next decade, it’s tougher to determine exactly when exponential growth will take off. Because of this, the time frame for this investment runs the risk of being longer than originally expected.

Acquisitions May Take Longer Than Expected to be Integrated in Operations: Over the past decade, IBM has engaged in hundreds of acquisitions to strengthen its new product portfolio. A large reason for the recent decline in margins is the difficulty of efficiently integrating this number of acquisitions into IBM’s core operations. In addition, in recent years profitability has almost halved, further indicating a failure to efficiently integrate acquisitions. If IBM cannot keep its profitability in line with its acquisitions, earnings may further deteriorate despite the company gaining market share.

Valuation

For our valuation, we conducted two analyses: a sum-of-the-parts (SOTP) analysis and a multiple analysis of the whole company. We conducted our SOTP analysis by breaking down revenue into strategic imperatives and non-strategic imperatives (with the exception of global financing since it is focused on the general financial structure of IBM). Strategic imperative revenues have increased at a CAGR of ~10% since they were introduced in 2014 and generally reflect revenues in IBM Watson and cloud services. By taking into account our future expectations of these industries, we applied a conservative positive growth rate for strategic imperatives’ revenue and continued the negative growth rate projection for non-strategic imperatives’ revenue. Eventually, we expect strategic imperatives to make up the majority of IBM’s revenue. Pre-tax income margin was also kept conservative and constant from prior years according to the respective segments. Practically, we expect modest margin improvement as acquisitions become integrated within the company’s operation; moreover, management expects margin improvement in 2018. We also concentrated interest within the global financing segment since IBM’s treats it as a separate company within IBM, consolidating all debt within it.

We then conducted a comparable company analysis for each individual business segment. We used the EV/EBIT multiple for capitalization instead of EV/EBITDA since we believe EBIT provides a better representation of the profitability of the company as IBM has a significant amount of capital assets that would affect EBITDA values and the final valuation. In addition, we believe that the effective integration of acquisitions will directly affect EBIT, providing us with a “check” on our assumptions. If IBM’s margins continue to deteriorate, this will be a sign that we did not correctly gauge the ability of management to improve margins. The mean EV/EBIT was used for technology services and cloud platforms, global business services and global financing. We calculated the mean multiples by taking the average of companies operating exclusively in the different segments of IBM. The low EV/EBIT was used for Systems for a more conservative valuation since the average multiple for data center companies are significantly inflated. There are no comparables for cognitive solutions because many companies in this space are private and recent transactions offer little public information on the multiples these companies were purchased for. Hence, we decided to use a conservative EV/EBIT multiple of 15x for this portion which is equal to the current EV/EBIT multiple assigned to IBM. Implied EV for each business segment were summed, and we concluded that the implied return on investment is approximately 65% over the next 3 years.

For the whole company analysis, operating income contributions across all 5 business segments were summed and we used an industry average EV/EBIT multiple of 15x for the base case, 18x for bull case and 10x for bear case. The risk-adjusted return on investment, with the weighted average of 60% for base and 20% each for bull and bear, is approximately 51% over the next 3 years. This analysis does not take into account the company’s dividend yield of approximately 4% per annum and share repurchases which have averaged 4.1% of total capitalization per annum over the past five years.


New Year Reflections

When I began this blog, I put forth my investment philosophy, citing that I would be following Benjamin Graham’s method of valuation. Over the last year, I posted analyses of many companies, indicating that they were value investments- later in the year, I decided to take a step back from analyzing companies because my returns were not satisfactory. I started studying a number of books, namely The Intelligent Investor and Security Analysis by Benjamin Graham. After learning about value investing from its source, I have decided that many of my analyses did not qualify as value investments in a fundamental sense.

To begin, Graham draws a distinction between investment and speculation. Speculation is guesswork about future events: for example, purchasing TARO stock on the assumption that Sun Pharmaceuticals would purchase 90% of outstanding stock, forcing it to pay a premium for the last 10%. Speculation, however, can also take other forms, especially in so-called “turnaround investments”. When I wrote about Barnes and Noble Education (BNED), I showed how BNED was cheap from an asset perspective; however, the requirement for value realization would be a dramatic increase in earnings that, frankly, was not warranted by a historical study of the company’s income statement. I now classify these, as well as some other analyses, as speculations instead of investments.

An investment, according to Graham, is a thorough historical study of a company’s income and balance accounts, and making a decision based on established quantitative tests of safety. That is, we need to determine, based on a study of the past and reasonable assumptions about the future, the safety of our principal and a reasonable expectation of appreciation. You will see that I use the word ‘reasonable’ a lot; that’s because value investing is not an exact science. What ought to be assured, however, is a safety of our principal. As Buffet facetiously quips, “Rule number one, don’t lose money. Rule number two, don’t forget rule number one.”

I will mention that such a philosophy built upon safety will miss many investment opportunities. To throw out a ballpark number, I will probably miss out on a number of companies that enjoy price appreciation in the future but are trading at a P/E of, say, greater than 40 today. That is not to say that a case cannot be made for these companies’ current valuation; it is merely an avoidance of investments that either qualify as speculation or do not guarantee a safety of my principal. This type of investing-by-avoidance has been dubbed many names- circle of competence, punch-card investing, etc.- but I’ve found that often the meaning of certain ideas are distorted when these terms are used colloquially. I’m sure that the number of individuals who call themselves value investors and the actual number of value investors by practice diverge widely. I prefer to make my investment philosophy clear without the use of these blanket phrases.

I mentioned “established quantitative tests of safety”. To be fair, these tests have not been determined by myself- in fact, they will vary from investor to investor and even company to company. You will not require the same debt-to-equity ratio for a bank than you would an industrial company. This is not to say, however, that this style of investing is simply a stock screener. Companies that fail to meet certain tests are not automatically designated as bad investments; on the contrary, these divergences lend themselves to closer scrutiny. Extreme values on either side of the spectrum must be studied with care, their cause identified and dealt with accordingly. A restaurant with a high debt burden relative to the industry just because its management decided to purchase its properties rather than rent them should not be automatically disqualified.

The last idea I should modify is the concept of margin of safety. In practice, we assume the margin of safety to be a difference between the appraised price and the actual price of a stock. However, the margin of safety can take many forms; for example, take a large, prominent company benefiting from a durable competitive advantage. Naturally, its stock will drop below its intrinsic value very rarely, perhaps only during recessions (and maybe not even then). In such companies, Graham defines the margin of safety as the difference between the stock return and the senior bond return. The idea is that this spread is your “reward” for taking on the extra risk of buying the common stock of the company instead of its senior bonds. Buffet also mentions, “its far better to buy a great company at a fair price than a fair company at a great price.” That is, it is permissible to give up your margin of safety granted that the company is large prominent and benefits from a durable competitive advantage. How do we test for the latter? Well, if your neighbor has never heard of the company, it probably doesn’t pass the test. In essence, in such investments your “margin of safety” is the competitive advantage of your company (as Graham puts it, the ability to maintain and even grow future earnings power).

Finally, I look at investments in terms of opportunity cost. Right now, most of my cash is earning nothing, so I would presumably invest in any situation that has a chance of price appreciation. However, as I make more investments, my opportunity cost for each decision will be greater, and investment opportunities should be evaluated as such. For example, if I expect an annual 10% gain in IBM, I will only consider investing in Company X if it offers a potential gain greater than 10% annually (otherwise I would be more comfortable simply putting more money in IBM).

If I could describe my new investment style in one sentence, it would be this: I only want to make investments that don’t keep me up at night.

Portfolio Focus

Last year, I mentioned that this blog would focus on my portfolio rather than present a litany of investment ideas. While I adhered to this principle for the first half of the year, I suspended it during the second half because my portfolio had little activity. However, this year I plan to do something different: only post when I make a portfolio update. This may be 5 times a year, or even zero times a year. Previously, I tried to post one investment idea per month, but this method coerces me into venturing outside of my cozy world of value investing into speculation.

There is also an element of risk associated with a 100% stock portfolio, no matter how diversified. In cases of economic recession, such a portfolio will be badly damaged. The alternative of keeping a certain percentage of your portfolio in cash is also unsatisfactory in that this excess cash will be earning nothing and be prone to the ravages of inflation. To minimize the repercussions of these polar opposites, Ben Graham advocates a fluid portfolio made up of high grade corporate bonds/U.S. Treasury Securities and common stock. In the median state, the portfolio would be divided in a 50/50 ratio. In the upper tranches of a bull market, the ratio would be 25/75 in favor of bonds. In the lower tranches, 75/25 in favor of common stock. While this formula implies timing the market, it need not be that way. One could set an arbitrary interval, say 20% intervals, to begin selling (in case of a 20% gain) or buying (in case of a 20% drop) a certain percentage of his common stock holdings and put the proceeds in bonds. In this scenario, the portfolio would naturally lean toward the 25/75 ratio as the market advances and 75/25 as the market declines. Currently, I am obtaining trading privileges for bonds, but will follow this strategy once I can begin actively trading bonds.

Keeping with my aforementioned commitment, here is a snapshot of my portfolio as it stands today:

Screen Shot 2018-01-07 at 11.06.27 AM

You will notice that I sold many of my holdings, namely BNED, ANFI, BBBY and IDCC. For the sake of completeness, BNED was sold for a 30% loss (8% of portfolio), ANFI 21% gain (10% of portfolio), BBBY 20% loss (1% of portfolio) and IDCC for a 7% gain (10% of portfolio). The reason for selling all of these stocks was purely to start on a clean slate with my new investment philosophy. In addition, I concluded that none of these qualified as value investments.

I purchased Tractor Supply Co (TSCO) shortly after modifying my new investment approach. You can read my full analysis here. Since I’ve purchased the stock, I’ve seen a 36% gain which is beyond satisfactory. However, short-term market movements are not indicative of long-term value creation and I plan to hold TSCO for the foreseeable future (that is, unless a more enticing investment opportunity presents itself and my portfolio is saturated).

You will also see that I purchased International Business Machines (IBM). The rationale behind this purchase was simple:

Many times, when a new trend takes foot, previously acclaimed companies fall out of glamour. This lack of attention can create a value opportunity. Right now, the big trend is artificial intelligence, Internet of Things (IoT) and the digitalization of our lives, from mobile payment systems to restaurant apps. We can see this empirically if we look at a few companies. The biggest example is Amazon (AMZN), the mogul of online retailing, which is trading at an ever-growing P/E of 275. Since Starbucks (SBUX) introduced its mobile app in 2014, its stock has appreciated dramatically. Recently, PayPal (PYPL) spun off from Ebay (EBAY) and its stock has gone from just under $40 to over $70 in a year. In the world of artificial intelligence, Apple (APPL) kick-started the race with the introduction of Siri, but has fallen behind as the other technology companies are introducing their own artificial intelligence systems. Amazon in particular gained widespread attention after the debut of its Alexa system, which is said to transform the consumer’s home.

In this storm of new technologies, IBM is the company that has lost its glamour with a P/E of just over 10. To be fair, the company has had falling revenues for the past five years: this is a result of its legacy business dying. As companies are moving towards cloud based systems and big data is becoming the norm, IBM has been playing catch-up. To give some context, revenues were over $20 billion 5 years ago, and only $17 billion last year. To combat this, IBM has begun acquiring cloud-based businesses, and its cloud-based revenue is increasing by double digits year-over-year. Two other things IBM has adhered to, and this is essential for this thesis, is share buybacks and dividends (which it has maintained for 100 years).

Since this decline began, IBM stock has decreased at a rate of about 6% per year. Keeping in mind that this was caused by a 15% hit on revenues, we can entertain the assumption that if this decline continues, the stock will have a similar future. This year, IBM decreased more steeply, but this was right after Buffet announced that he sold a third of his stake. Nevertheless, 100% of this decline, however, was cushioned by share buybacks and dividend payments. Thus, if this continues, we can reasonably assume that our principal will not be compromised given that IBM continues to adhere to its share buyback and dividend policies.

I mentioned that IBM is playing catch-up. Will it eventually catch-up? Given its history, I would venture to say yes. In fact, if we assume the most dismal state (above), we are assuming the demise of the corporation itself. However, I can say with reasonable certainty that IBM will continue to persist in the future. The great part about this investment is the high dividend yield (about 4%). Therefore, IBM stock need only appreciate 6% YoY to beat the average S&P gain.

Tractor Supply Co (NYSE: TSCO): The Billion Dollar Company You’ve Never “Herd” Of

Shehryar, you’ve been relatively quiet recently. What’s been going on?

I decided to take step back from actually analyzing companies for a while in order take some time to expand my breadth of knowledge when it comes to investing. Specifically, I had qualms about some of my recent analyses- for some reason, they didn’t fit well with my philosophy of value investing. As a result, I began to study Warren Buffet- and through snit-bits of interviews and quotes, I got a good idea about how he actually analyzes his companies. Then I had an epiphany: while my analyses are technically considered value investments, they do not bode well with value investing as it is practiced today.

The obvious indication of this was simply the frequency at which I posted ideas. Buffet uses the analogy of an at-bat: while you’ll be able to hit many pitches, you should only take the hit on the very best if you want a home run. I think many investors fall into the sunk cost fallacy- the concept that an idea ought to produce an investable upside since you already put weeks, sometimes months, of research into the company. In reality, you may just be setting yourself up for failure by adhering to such a philosophy.

Okay, great. So, what’s changed as a result of this exploration?

Well, I can identify four tangible things that have changed in my analyses:

  1. In the past, I’ve looked exclusively for bargain stocks rather than companies with economic moats. Some examples include NROM, ANFI and BNED. This isn’t necessarily a bad thing, there are times when these companies make you unable to sleep at night, as was the case with BNED, which dropped 18% since I initiated a position in it. The value investing philosophy dictates, “if you have a clear conviction in an idea, then you should add to your position when the price drops.” The problem with this statement in the context of my strategy is that it is hard to have a clear conviction in a company like BNED- while it very well may prove to be a fabulous investment, it still keeps me up at night for the time-being. Therefore, I’ve altered my approach: I look for companies with economic moats trading at a bargain or fair value.
  2. I do not look at the stock price before analyzing a company. I’ve noticed an inherent bias when I know the market capitalization of a security that cajoles me to subconsciously smudge the numbers to produce an upside. If you do not know the market capitalization, you’ll be more inclined to come up with the true intrinsic value.
  3. I’ve changed my ROIC figure to “Return on Tangible Assets”. This is a figure that Buffet talks about a lot that is much more conservative than a traditional ROIC calculation- it removes to effect of excessive depreciation. It is defined as net income/(TOTAL PPE + Current Assets – cash).
  4. A company can do two things with earnings: retain them or give them out in dividends. According to Buffet, unless a company can produce >$1 value for every $1 of retained earnings, it is better off giving the money out in dividends. To calculate this, you can either take the growth in earnings or the growth in market capitalization and divide it by the total retained earnings- the quotient should be greater than 1.

That sounds reasonable. I heard you invested in Tractor Supply Co (NYSE: TSCO). Can you tell me a little bit about that company?

Tractor Supply is a retailer of agricultural products. The company was founded back in the 1950’s and originally sold tractor parts. They then started expanding into the agricultural market, providing equipment, livestock feed and everything in between. Recently, they’ve been focused on growing their edible products- horse feed, bird feed, and the like- and livestock segment, which have generated over 40% of their revenue over the past decade. The company originally operated two segments: Tractor Supply Co, with 855 stores in 2008, and Del’s Farm and Feed, with 28 stores in 2008. TSCO has been aggressively growing its Tractor Supply segment and has adhered to an 8% increase in selling space YoY since 2008. The number of Tractor Supply stores has grown to almost 1,800, for a CAGR of 7.4%. Del’s Farm and Feed has not been growing and is now negligible. In 2016, TSCO purchased Petsense, as part of its ongoing effort to expand its edible product footprint, for a purchase price of ~$160m. Going forward, TSCO sees a domestic opportunity of 2,500 Tractor Supply stores and 1,000 Petsense stores.

Tractor Supply’s stock has fallen 25% since 2016 because of lower comparable store growth. According to the financial statements, warmer winter months and deflation were the primary causes of this decline. However, I think Tractor Supply is a stable company with an economic moat- and this short-term weather problem is transitory at worst. Even in this so-called “challenging year” the company still managed to deliver positive same-store sale growth and 9% growth in both revenue and net income. TSCO has a market capitalization of $7.3bn and 131 million shares outstanding.

Wait a second! You think an agricultural retailer has a durable competitive advantage? Can you please explain how that is?

Let’s first look at it from a qualitative standpoint. TSCO has been able to grow its business at a tremendous rate for over a decade with no signs of slowing down. From 2008-2013, the company delivered YoY double digit revenue and EPS growth. Speaking of 2008/2009, the company showed no signs of slowing down during the recession; on the contrary, TSCO consistently surpassed expectations. Finally, TSCO has no established competitors and loyal customers. This demonstrates some degree of barriers of entry, and during the whole internet revolution/e-commerce revolution, people did not stop shopping at Tractor Supply stores.

Now let’s look at it from a quantitative standpoint. A company with a competitive advantage should have a high return on tangible assets. Because this calculation adds back accumulated depreciation, our threshold should be lower: any company with a ROTA greater than 10% is using its capital efficiently. While TSCO’s ROTA has been consistently above average, this is exacerbated by the fact that ROTA has been growing over the years. More than that, along with ROTA growth, the company’s margins have been increasing as well, indicating economies of scale.

Picture1

The second test is the retained earnings test. An efficient company should theoretically be able to produce at least a dollar of value for every dollar of retained earnings. From an EPS standpoint, for the past decade, TSCO has produced $0.18 of earnings growth for every dollar of retained earnings (defined as net income less dividends). From a market capitalization perspective, since 2009, market capitalization increased by less than $1 for every dollar of retained earnings twice:

Picture1

Read in conjunction with the earnings perspective, we can see that 2014 and 2016 were not caused by a decline in efficiency, but short-term market fluctuations/transitory effects. Overall, every dollar of retained earnings since 2009 caused $3.48 increase in the value of the company from a market capitalization perspective.

These are great numbers, but let’s look at this situation from a realist perspective. Don’t you think competition from Amazon is going to destroy TSCO?

 Since you’re being persistent, there are three major challenges that Tractor Supply faces:

  1. Threat from Amazon or other online retailers: To start, the target market of Tractor Supply is farmers, not technology savvy millennials. This market is not 100% responsive to new technological changes, and that means there is some sort of barrier between it and the E-commerce revolution. Additionally, many of these farmers live in rural areas or have farms/ranches in rural areas- for the most part, they do not live in zip-codes with “same day shipping”. Tractor Supply stores themselves are located in these rural areas to cater to this specific need. Therefore, Amazon and other online retailers will find it hard to ship products efficiently to these areas. Speaking of products, there is also the issue of the type of product. Many of these products are, by nature, bulky, making them expensive to be shipped by an online retailer (think of bunches of hay). Second, these products are needed in a moment’s demand- farmers would not want to wait for two days to restock on their feed. These factors, coupled with the expertise and impressionability of Tractor Supply workers mitigate the effect of e-commerce on Tractor Supply’s target market.
  2. Threat from other retailers: Again, there are no close counterparts to Tractor Supply’s business. The only potential threat are local retailers, but history has shown us this is not a problem. Tractor Supply existed in 25 states in 2008, and now exist in 49 states, so penetration in new markets does not present a challenge to TSCO. You may argue, “What about established retailers like Home Depot?” These large retailers do not carry the specialized selection of products you’ll find in a Tractor Supply store. You may be able to get a power drill in both places, but you cannot get a power drill along with horse bedding at Home Depot. Tractor Supply changes its product selection every 90 days to keep in line with the agricultural season- no other large retailer does that.
  3. Petsense acquisition may destroy value: This is the only risk that I think can go either way. Petsense is not an established business, and may not be able to compete against PetSmart, PetCo, etc. Management plans to expand Petsense by 20% YoY and eventually reach 1,000 domestic stores. In the short term, however, Petsense is not a big player and even if you eliminate it from my valuation, you are still left with a substantial upside.

But how do you find value in this company? As you said, same-store sale growth has been slowing down- even if the company grew 8% YoY in the past, why should it grow in the future?

You bring up a valid point, and that is why we should not depend on future growth when it comes to this investment. So, let us go through this thought experiment: imagine if we can buy this company, and it stopped growing completely after we purchase it. That means same-store sales growth is 0% and no new stores are opened despite the domestic market opportunity of 2,500 stores.

We can start with the 2016 EBIT of $694m. First, we add back depreciation and subtract maintenance capex- no growth means that some of the capex will not be used. The cost to open a new store is $1m/store and the company opened ~130 stores in 2016, so the maintenance capex is ~$100m ($226m total capex minus growth capex of $130m). Taking away tax, we have adjusted earnings of $479m. Historically, TSCO has had a P/E in the high 20’s, but this took into account growth prospects. In this steady-state situation, we can slash the P/E in half to get a steady-state value of $6.85bn.

Screen Shot 2017-10-28 at 1.04.10 PM

Okay, so you’re coming up with a value of $6.85 billion, but the market cap is $7.3bn. Where does the upside you were talking about come from?

Well we went through some pretty serious assumptions to get to this value. First, we assumed that margins will stagnate. Keep in mind that the margins we see today are, in part, a result of the excessive growth of TSCO. In a zero-growth case, we can reasonably assume that the company can focus on efficiency and actually improve margins to an extent. Second, we took off about half of capital expenditures because of new store openings. The $1m per store is simply the cost of obtaining the store- it doesn’t take into account hiring personnel to run it, the logistics, etc. In fact, according to TSCO’s Q3 Investor Presentation, only 14% of total capex is reserved for existing stores. Third, we didn’t take into account share repurchases. TSCO recently announced an aggressive share repurchase program, with the goal of 2.5-3.5% annual net share reduction. Without growth, the company will have more capital to repurchase shares (at least ~$100m that was previously used for growth capex) and greater liquidity to take on debt. We can assume a net share reduction of 4.5% in a zero-growth case. Finally, keep in mind that we slashed the P/E in half to come up with our steady-state value. We used a P/E of 14, but the average P/E for Special Lines Retail is 23 and the average P/E for farming/agriculture is 20. After considering these factors, it is easy to see the upside in this investment; to illustrate this, if we take into account only 25% of capex as maintenance capex and an operating margin expansion of 2%, our initial yield will be 8%.

Screen Shot 2017-10-28 at 1.03.28 PM

After taking into account the net share reduction, our annual ROI will be 12.5%, and this is assuming no growth. In reality, the company is growing at 8% YoY. In essence, in this investment we are getting growth for free.

Wow, this is shaping up to be a very nice investment! You said that we are essentially getting growth for free, but what exactly is the value of this growth?

What I like about this company is that you don’t need growth for it to be a great investment, contrary to what others think. A previous Seeking Apha article mentioned, “Upside here requires an acceleration in same-store sales,” but as I’ve shown, comp growth can be 0% and we still get a nice return on our investment. What are we really getting for our $7.3bn, though? We are getting a YoY increase in selling space by 8%, double digit EPS growth, high single digit revenue growth and 20% YoY growth in Petsense. To be fair, however, we will continue playing Devil’s Advocate even when delving into the growth value of Tractor Supply.

In 2008, Tractor Supply calculated a domestic market potential of 1,200 stores. In 2011, it increased that to 1,600 stores and again in 2014 to 2,100 stores. Most recently, it was 2,500 stores. For simplicity’s sake, let us assume that growth will taper off at 2,100 stores even though history has shown us that this probably won’t happen. Also, let’s continue with our 0% comp growth assumption. Right now, Tractor Supply has ~1,800 and they’re increasing their number of stores by ~130 every year. We can assume that in three years’ time, there will be at least 2,100 Tractor Supply stores in the United States. Each store makes $4m in revenue today, so 2,100 stores will bring in at least $8.4bn in revenues in 2021. The current net income margin is 6.5%, so let’s assume that same margin in 2021, even though it has been on an upwards trend. Applying a cost of capital of 10% and a terminal growth rate of 5%, the value for Tractor Supply is $10.92bn (alternatively, this translates to a P/E of 20 which is average for this industry).

We can do the same thing with Petsense. The company has ~160 stores right now and plans to open 30-40 stores per year. In three years, there will be about 300 Petsense stores and each store makes $1m in revenue annually. On management’s Q3 earnings call, management stated that Petsense margins were in line with Tractor Supply margins, so we use the same net income margin, cost of capital and growth rate (in reality, the growth rate of Petsense is expected to be 20-25% annually). This gives us a value of $1.56bn.

Together, the value of the company should be $12.48bn by 2021. The current market capitalization is $7.3bn, giving us a 71% upside. Since the value is realizable in three years, our annual return on investment is 19.6%. This calculation did not take into account the net share reduction of over 10% that is expected over the next three years, which will amplify our return on investment.